A sequence alignment viewer with Bokeh and Panel
Background
Sequence alignment is a common task in molecular biology. There are many tools for viewing such alignments like AliView, Clustalx and Mega. Following from a previous article on using pyviz/panel for dashboards, this post details how to make our own multiple sequence alignment viewer with Panel and Bokeh. Bokeh is an interactive plotting library for Python for use in web browsers and dashboards. Bokeh renders its graphics using HTML and JavaScript and can be very flexible if you are willing to invest the time in learning how to customise it. Here we want to be able to:
- display text in a grid with a row for each sequence
- be able to scroll from left to right
- color by base
- have a preview plot showing an overview
We will then make a basic app using Panel widgets to show how it can be used in a dashboard. As before the code is written, tested and run inside a Jupyter notebook. It can be deployed as a standalone server too. To install all requirements for this example run the following. Note I tested with python3 for ubuntu use pip3 to ensure you install for the right version. You can also use conda.
pip install jupyter biopython panel bokeh
Imports
Once you have started a new jupyter notebook you can import the required packages as follows:
import os, io, random
import string
import numpy as np

from Bio.Seq import Seq
from Bio.Align import MultipleSeqAlignment
from Bio import AlignIO, SeqIO

import panel as pn
import panel.widgets as pnw
pn.extension()

from bokeh.plotting import figure
from bokeh.models import ColumnDataSource, Plot, Grid, Range1d
from bokeh.models.glyphs import Text, Rect
from bokeh.layouts import gridplot
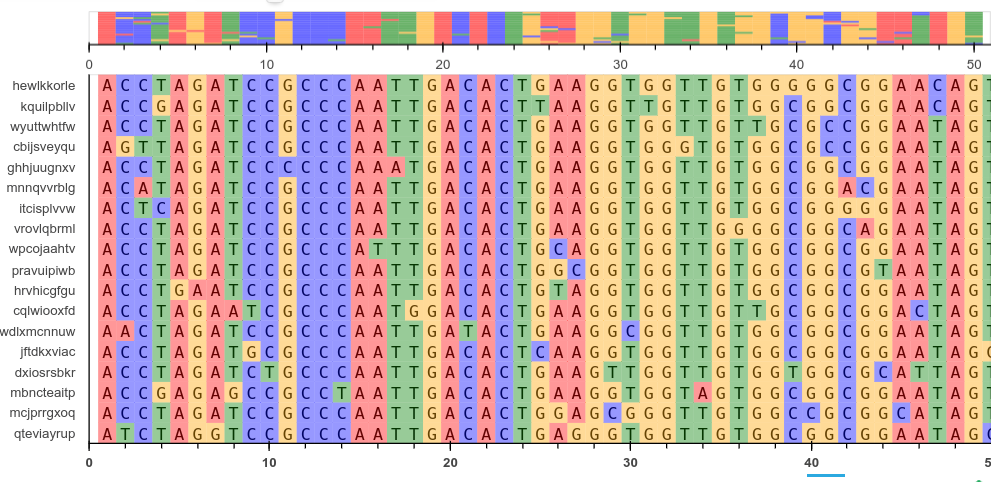
Bokeh sequence plotter
This code creates a bokeh figure and plots text glyphs in a grid. This is done by creating a ColumnDataSource object. This is a key structure in bokeh that deals with interpreting your data to the glyphs you see in the plot. It can be created from pandas dataframes, numpy arrays or lists. Here we make the coordinates, sequence text and colors into 1D arrays and pass them all to the constructor. The columns in this object are later referenced when adding plot elements. Note that we use the same source object for both plots. You can refer to the Bokeh documentation for more details. The function takes a biopython alignment object as input.
def view_alignment(aln, fontsize="9pt", plot_width=800):
    """Bokeh sequence alignment view"""

    #make sequence and id lists from the aln object
    seqs = [rec.seq for rec in (aln)]
    ids = [rec.id for rec in aln]
    text = [i for s in list(seqs) for i in s]
    colors = get_colors(seqs)
    N = len(seqs[0])
    S = len(seqs)
    width = .4

    x = np.arange(1,N+1)
    y = np.arange(0,S,1)
    #creates a 2D grid of coords from the 1D arrays
    xx, yy = np.meshgrid(x, y)
    #flattens the arrays
    gx = xx.ravel()
    gy = yy.flatten()
    #use recty for rect coords with an offset
    recty = gy+.5
    h= 1/S
    #now we can create the ColumnDataSource with all the arrays
    source = ColumnDataSource(dict(x=gx, y=gy, recty=recty, text=text, colors=colors))
    plot_height = len(seqs)*15+50
    x_range = Range1d(0,N+1, bounds='auto')
    if N>100:
        viewlen=100
    else:
        viewlen=N
    #view_range is for the close up view
    view_range = (0,viewlen)
    tools="xpan, xwheel_zoom, reset, save"

    #entire sequence view (no text, with zoom)
    p = figure(title=None, plot_width= plot_width, plot_height=50,
               x_range=x_range, y_range=(0,S), tools=tools,
               min_border=0, toolbar_location='below')
    rects = Rect(x="x", y="recty",  width=1, height=1, fill_color="colors",
                 line_color=None, fill_alpha=0.6)
    p.add_glyph(source, rects)
    p.yaxis.visible = False
    p.grid.visible = False

    #sequence text view with ability to scroll along x axis
    p1 = figure(title=None, plot_width=plot_width, plot_height=plot_height,
                x_range=view_range, y_range=ids, tools="xpan,reset",
                min_border=0, toolbar_location='below')#, lod_factor=1)
    glyph = Text(x="x", y="y", text="text", text_align='center',text_color="black",
                text_font="monospace",text_font_size=fontsize)
    rects = Rect(x="x", y="recty",  width=1, height=1, fill_color="colors",
                line_color=None, fill_alpha=0.4)
    p1.add_glyph(source, glyph)
    p1.add_glyph(source, rects)

    p1.grid.visible = False
    p1.xaxis.major_label_text_font_style = "bold"
    p1.yaxis.minor_tick_line_width = 0
    p1.yaxis.major_tick_line_width = 0

    p = gridplot([[p],[p1]], toolbar_location='below')
    return p
We can test this plotter by loading an alignment from a file and showing the plot in a Panel Bokeh pane.
aln = AlignIO.read('test.aln','fasta')
p = view_alignment(aln, plot_width=900)
pn.pane.Bokeh(p)
A sequence alignment tool
Now we return to our previous example of a multiple sequence alignment app using Panel(PyViz). This one is an updated version using the Bokeh plotter and some new options. The widgets use Panel and allow us to select a varying number of sequences and lengths.
Helper functions
The following functions help us do some sequence utilities. For alignment we will use muscle which you can easily install on linux. The sequences are created by making rudimentary mutations to a single template.
def make_seq(length=40):
    return ''.join([random.choice(['A','C','T','G']) for i in range(length)])

def mutate_seq(seq):
    """mutate a sequence randomly"""
    seq = list(seq)
    pos = np.random.randint(1,len(seq),6)
    for i in pos:
        seq[i] = random.choice(['A','C','T','G'])
    return ''.join(seq)

def get_colors(seqs):
    """make colors for bases in sequence"""
    text = [i for s in list(seqs) for i in s]
    clrs =  {'A':'red','T':'green','G':'orange','C':'blue','-':'white'}
    colors = [clrs[i] for i in text]
    return colors

def muscle_alignment(seqs):
    """Align 2 sequences with muscle"""
    filename = 'temp.faa'
    SeqIO.write(seqs, filename, "fasta")
    name = os.path.splitext(filename)[0]
    from Bio.Align.Applications import MuscleCommandline
    cline = MuscleCommandline(input=filename, out=name+'.txt')
    stdout, stderr = cline()
    align = AlignIO.read(name+'.txt', 'fasta')
    return align
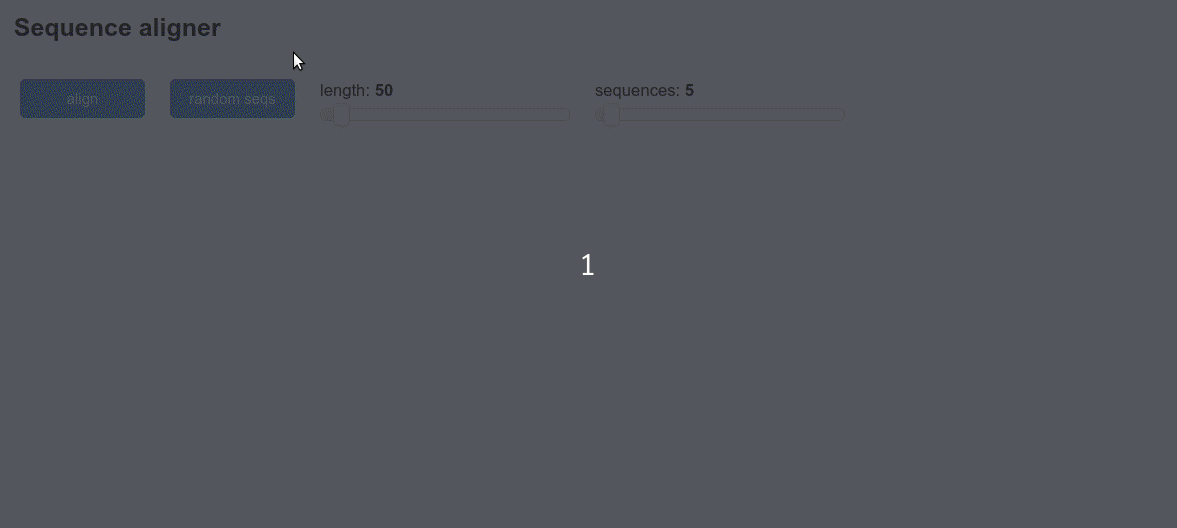
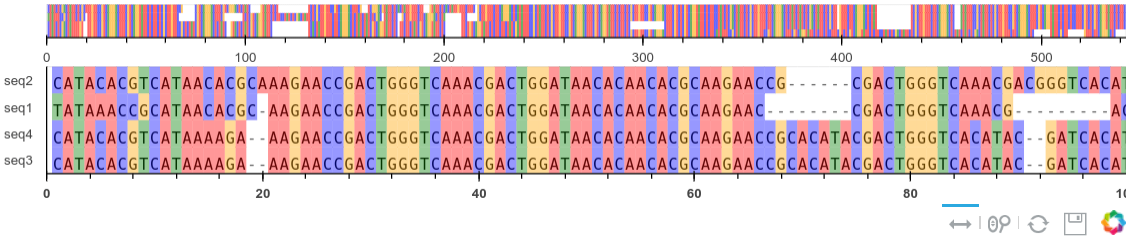
Aligner dashboard
Finally we can now create the dashboard that makes the random mutated sequences and displays them.
title = pn.pane.Markdown('## Sequence aligner')
load_btn = pn.widgets.FileInput()
aln_btn = pn.widgets.Button(name='align',width=100,button_type='primary')
randomseq_btn = pn.widgets.Button(name='random seqs',width=100,button_type='primary')
numseqs_input = pn.widgets.IntSlider(name='sequences',start=2,end=50,value=5,width=200)
length_input = pn.widgets.IntSlider(name='length',start=10,end=500,value=50,width=200)

seq_pane = pn.pane.Str(name='sequences',height=300)
result = pn.pane.Str("empty",width=600)
bokeh_pane = pn.pane.Bokeh(height=100,margin=10)

def create_sequences(event):
    #creates a set of sequences using widget values
    s=''
    seqlen = length_input.value
    startseq = make_seq(seqlen)
    num = numseqs_input.value
    for i in range(num):
        seq = mutate_seq(startseq)
        name = ''.join([random.choice(string.ascii_lowercase) for i in range(10)])
        s+='>%s\n' %name + seq+'\n'
    seq_pane.object = s
    return

def align(event):
    #this function does the alignment using the textinput values
    s = seq_pane.object
    sequences = SeqIO.parse(io.StringIO(s),format='fasta')
    sequences = [rec for rec in sequences]
    aln = muscle_alignment(sequences)
    #the result widget is then updated
    result.object = aln
    #aligned = [rec.seq for rec in (aln)]
    bokeh_pane.object = view_alignment(aln,fontsize="7pt",plot_width=600)
    return

aln_btn.param.watch(align, 'clicks')
randomseq_btn.param.watch(create_sequences, 'clicks')

top = pn.Row(aln_btn,randomseq_btn,length_input,numseqs_input)
bottom = pn.Row(seq_pane,bokeh_pane, sizing_mode='stretch_height')
app = pn.Column(title,top,bottom)
app
The final result will look like this: