DataExplore Features
This post details some notable features that might help you decide if this program could be useful to you.
Handles large numbers of rows
This software will handle tables with ~1 million rows with relative ease, depending on the number of columns. Mostly the limits are imposed by your computer memory. This means it is practical for analysis of so-called ‘medium data’ as it is characterized by Wes McKinney, the creator of Pandas.
Simple filtering
Currently filtering of the table is done using a quite simple string query method. An entry box is used to enter the query and the table updated accordingly. The main table is restored when the filters are cleared. The syntax is straightforward to learn for beginners and should be useful for teaching about logical AND/OR/NOT rowwise operations. See the help page for details on syntax.
Apply functions to columns with simple expression evaluation
This is the closest equivalent to using Excel formulas but functions are applied columnwise over all rows. The same as for filtering, a string is entered like a formula and if it can be parsed a new column is created. For example entering ‘x = a + b’ will create a new column x that is the sum of a and b. See help on functions
Child table
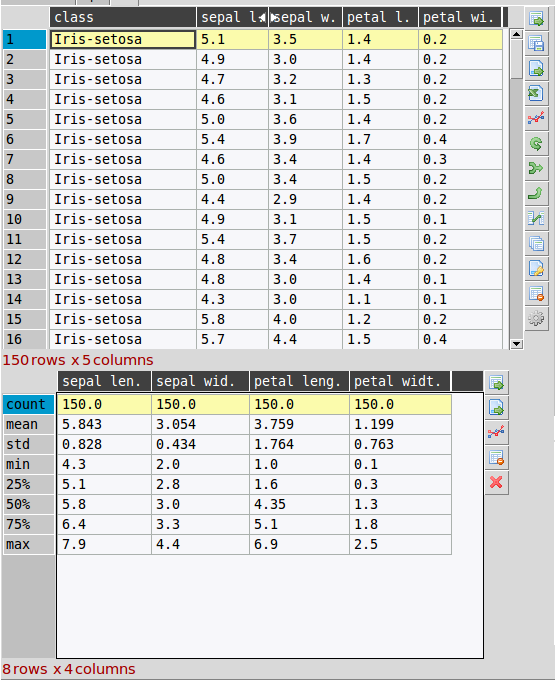
A useful feature of the program is the use of a ‘child’ or sub-table below the main one. This can be created and discarded when needed. Child tables are used for several purposes:
- temporarily placing all or some the main table in another frame for comparison
- to place results of common transformations such as aggregations or pivots
- for concat/merge operations where the second dataset is loaded into the child table first and then joined to the main table
- direct visual comparison between tables
You can plot from the sub-table as normal.
Use of indexes
The index is the way that the underlying DataFrame rows are labelled. This performs the central role in the Pandas library of data alignment or getting and setting of subsets of the table. A more novel aspect is the use of “hierarchical” indexing. This is essentially a way of representing data with an arbitrary number of dimensions in a 2D table. In our program mostly the use of multi-indexes is implicit to the way the program works but it opens the door to add more useful functionality later on. For now the index can be displayed or hidden in the table and columns can be turned into indexes. This is useful for display and plotting since the index is often the implied x-axis for plotting i.e. in line plots.
Categorical plots
Data can be broken down by categories or ‘factors’ and plotted in a few different ways:
- The software can be grouped by categorical columns in the plot dialog. Plots will then be seperately made for each group.
- Apply a categorical column as an index to the table and plot as normal. The data will be plotted accordingly.
- Use the more specialised tool provided in the ‘factor plots’ dialog. This is implemented using the Seaborn library.