Excess mortality in Ireland still high in 2023
Background
Previously we have looked at potential excess deaths in Ireland using data retrieved from RIP.ie. These represent quite accurate real-time all-cause mortality estimates that are an alternative to the official GRO data which lag behind by many months. It appears that the unusually high mortality signal present since around the start of 2021 continues to the present (December 2023). Below are updated plots showing now including 2023 data. Note that below total deaths are used for the remaining analysis. Strictly speaking it is better to use deaths per population. That is also shown in the plots below as deaths per 1000 and we can see there is not a huge difference in the trend. Therefore total deaths are used in the following. The excess deaths calculated are estimates and not meant in any way to be exact figures.

Deaths by year and deaths per 1000 adjusted for population.
Excess estimates
Previously we showed two several methods for calculating excess mortality. The simplest is to sum the weekly excess which is the weekly deaths minus the mean weekly value for a number of years. Of course the years used to calculate the mean are important. Here I used 2016-2020. We then just sum all the weekly excesses (positive or negative) for each year.

Sum of weekly excess over mean for 2016-2020.
Curve fitting method
This method is to fit the data to a periodic sinusoidal function that matches the regular yearly variation:
\[deaths = t + sin(t) + cos(t)\]Deviations from this baseline can be considered the excess deaths. The process involves subtracting the predicted values from the observed values for each time point. Mathematically, the excess deaths is then:
\[E_t = Observed\ deaths_t − Predicted\ deaths_t\]
where Predicted deaths is the value predicted by the fitted sinusoidal function at time t. If Et is positive, it indicates more deaths occurred than expected (excess deaths). If Et is negative, it suggests fewer deaths than expected. The 14 day rolling average was used for the fit. Using a smaller rolling window (e.g. 7 days) gives very similar results. We then just add up all the excess values for one year or season.
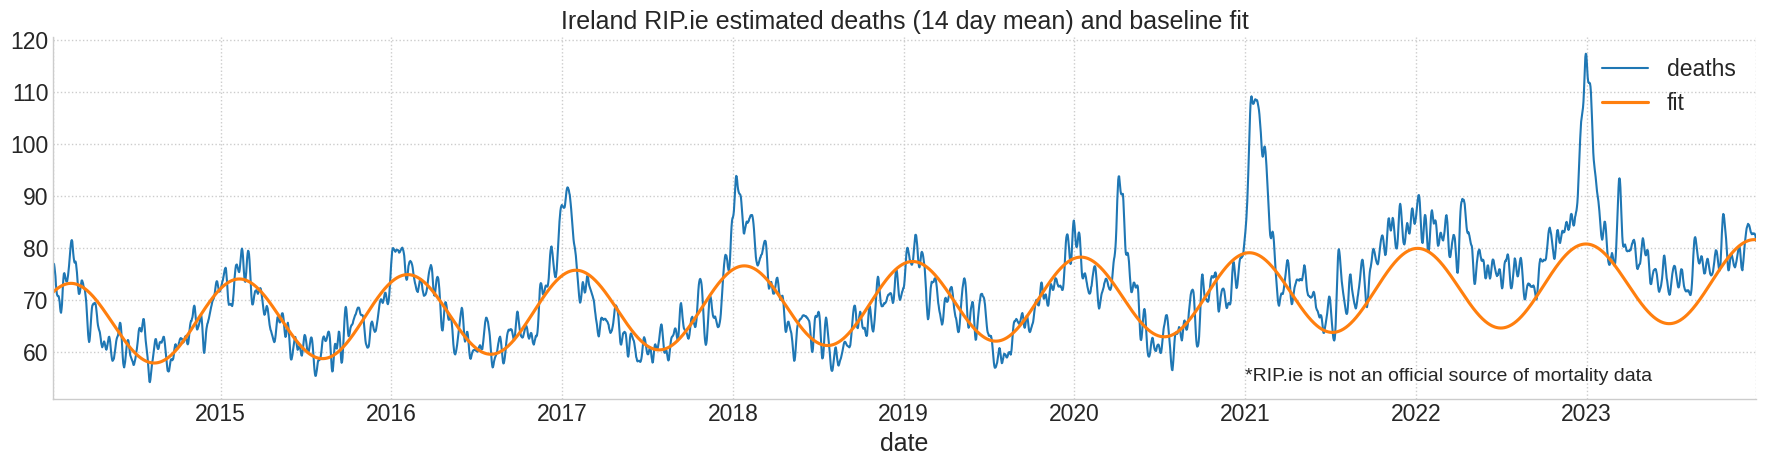
Baseline fit with periodic sine function.
The model is fit to the 2016-2020 data inclusive. Here are the excesses per year and season (June to June) using this method. 2023-2024 season is only partial.
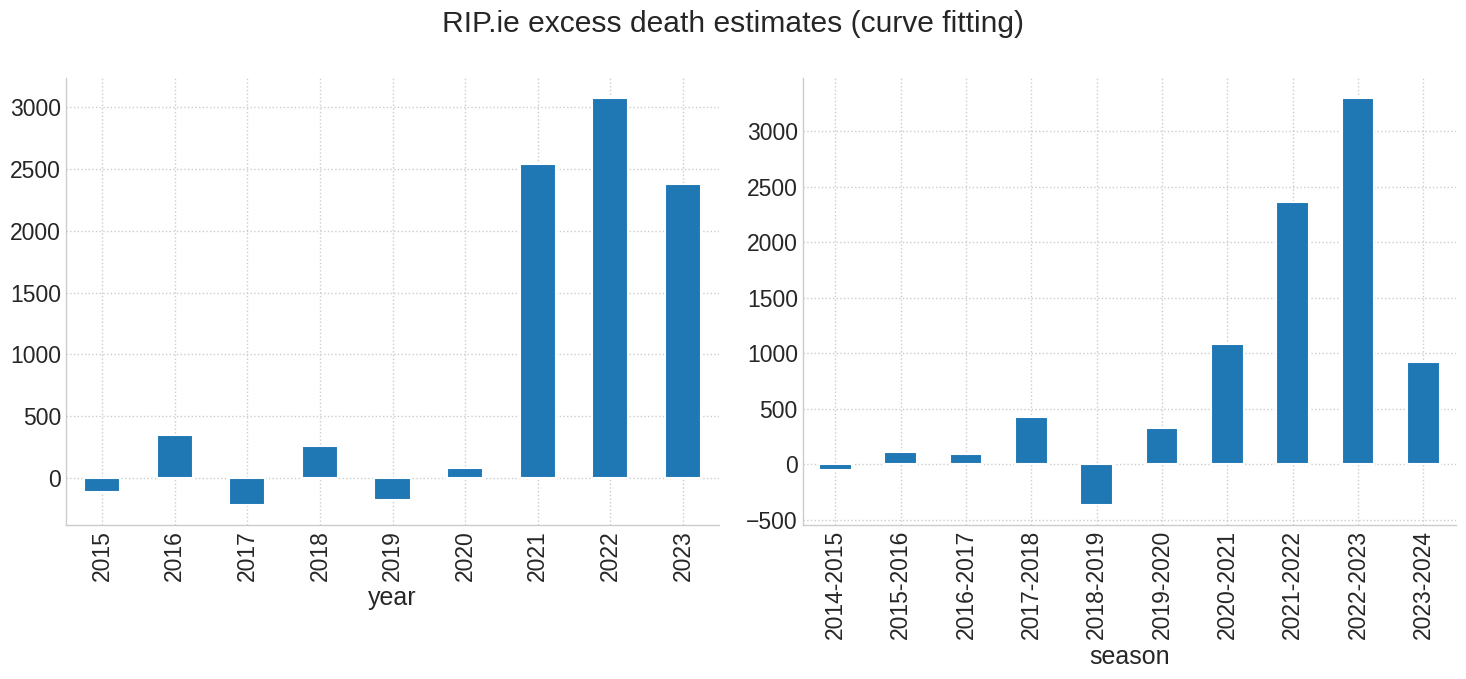
Excess estimates from curve fitting.
Which baseline?
It is easy to trick ourselves when choosing a baseline, whether from a fitted model or not. Above the model is fitted to the 2016-2020 data. This has the advantage of providing a stable model if recent fluctuations are considered anomolous, as in this case. However it could create an artificial bias. The expectation here is that recent years are out of the ordinary, but ultimately selection of the baseline is somewhat arbitrary. If we change the model to fit to the entire dataset it does change the results. The fitted curve now inflects upwards more thus negating some of the recent excess. However this also has the effect of severely skewing some previous years so that they appear to have large negative excess which seems unrealistic to me. Additionally the full data fit has a poorer R-squared value. This inclines me to think that fitting to the 2016-2020 period is a better approach.
Age adjustment
Irelands proportion of over 65s has increased steadily for some time. The death rate is expected to be accordingly higher with more older people. Adjustments are made for this in most analyses. I haven’t done so here and am using the raw numbers. However the baseline curve fit above does incline upwards with time, which should at least partly account for any such population effects.
CSO projections from 2016
It is also interesting to compare our data to total deaths predicted by the CSO in 2016 after the census. They projected annual deaths up to 2030 using models consistent with the trend in population age profile. Below we show the projections of one model (M1F1) with the actual data, showing the large divergence from 2021.
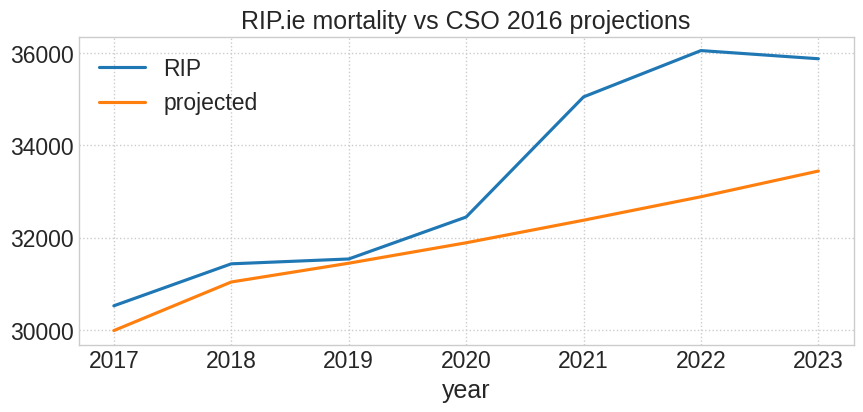
Deaths from RIP.ie vs CSO projections from 2016.
Eurostat data
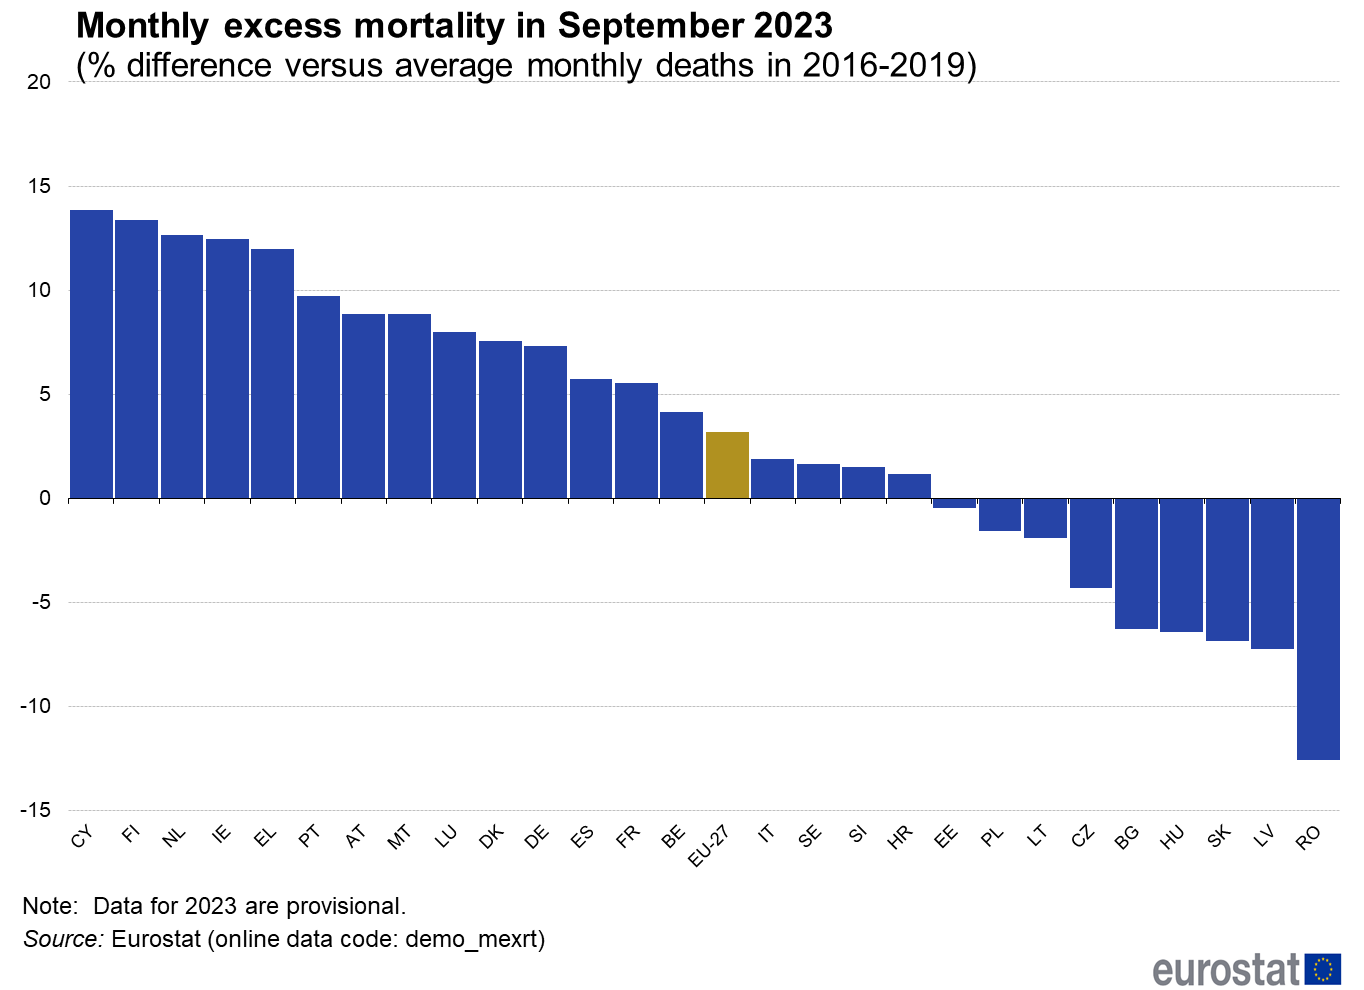
Finally, Ireland is not the only country experiencing excess mortality in this period. Eurostat make monthly estimates of mortality and show that Ireland has the fourth highest excess in the EU for September 2023. Their values are expressed as the percentage rate of additional deaths in a month, compared to the average of the baseline period 2016-2019.
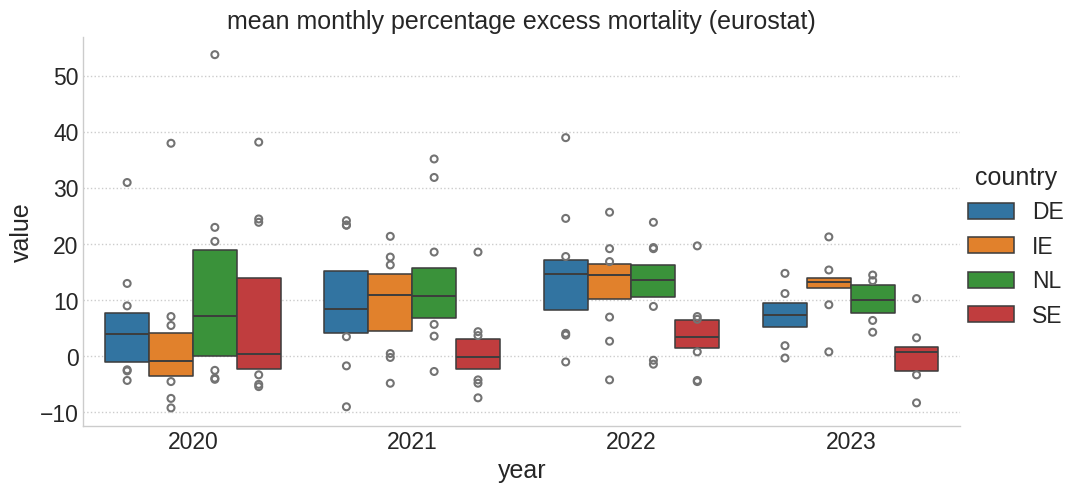
Eurostat mean monthly excess for Ireland, Germany, Sweden and Netherlands
Public health concern
If we take these figures as reasonable estimates there may have been roughly 8000 excess deaths from the start of 2021 to date. This should be a significant concern for public health authorities yet it appears to have received limited attention in the media.
Notes
- There may still be a slight over estimate of mortality in our result as deaths of non Irish residents abroad are often included on RIP.ie. These have to be removed along with deaths from Northern Ireland but some might have been missed. However this will be the same across all years so it shouldn’t affect excess calculations.
- The period from 2016-2020 is used as the baseline data for excess calculations. Note that this includes the Covid pandemic year as there was actually little or no excess death in 2020. This has been clear for some time and has even been reported recently in the Irish Examiner.
- Below 2016 the RIP estimates are not reliable but aren’t used here for any calculations.
Here are the values for estimated excesses and total deaths from 2017- derived from the curve fitting method. Once again, data is approximate and fits are an estimate.
| year | excess | total |
|---|---|---|
| 2017 | -218 | 30520 |
| 2018 | 260 | 31430 |
| 2019 | -176 | 31535 |
| 2020 | 79 | 32444 |
| 2021 | 2540 | 35048 |
| 2022 | 3074 | 36052 |
| 2023 | 2453 | 35936 |