Make a contact network from a geopandas geodataframe
Background
Similar to the previous post the example here shows how to get a contact network from a random geodataframe of points. Unlike the delaunay graph this uses a distance threshold to determing if nodes should be connected. The function returns the position of nodes taken from the original geodataframe. The attrs parameter is if we want to assign any of the columns in the dataframe to the node attributes.
Code
def random_points(n, bounds=[10,10,1000,1000], seed=None):
    """Random points"""

    np.random.seed(seed)
    points = []
    minx, miny, maxx, maxy = bounds
    x = np.random.uniform( minx, maxx, n)
    y = np.random.uniform( miny, maxy, n)
    return x, y

def random_geodataframe(n, bounds=[10,10,1000,1000], seed=None):
    """Random geodataframe of points"""

    x,y = random_points(n, bounds, seed)
    df = pd.DataFrame()
    df['geometry'] = list(zip(x,y))
    df['geometry'] = df['geometry'].apply(Point)
    gdf = gpd.GeoDataFrame(df, geometry='geometry')
    gdf['ID'] = range(n)
    return gdf

def geodataframe_to_graph(gdf, key=None, attrs=[], d=200):
    """Convert geodataframe to graph with edges at distance threshold"""

    from scipy.spatial import distance_matrix

    cent= gdf.geometry.values
    coords = [(i.x,i.y) for i in cent]
    distances = distance_matrix(coords,coords)

    # Create an empty graph
    G = nx.Graph()
    for i in range(len(gdf)):
        G.add_node(i, pos=cent[i])
    # Loop through all pairs of centroids
    for i in range(len(gdf)):
        for j in range(i+1, len(gdf)):
            if distances[i][j] <= d:
                G.add_edge(i, j, weight=distances[i][j])

    pos = dict(zip(G.nodes, coords))
    nx.set_node_attributes(G, pos, 'pos')
    #rename nodes
    if key != None:
        mapping = dict(zip(G.nodes,gdf[key]))
        #print (mapping)
        G = nx.relabel_nodes(G, mapping)
    for col in attrs:
        vals = dict(zip(G.nodes, gdf[col]))
        nx.set_node_attributes(G, vals, col)
    # Assign edge attributes to the graph
    #for u, v, data in graph.edges(data=True):
    #    data["length"] = data["weight"]

    return G,pos
Examples
These plots are fairly self explanatory. As we increase the distance threshold (d) there are more edges. This will depend on the total bounds given.
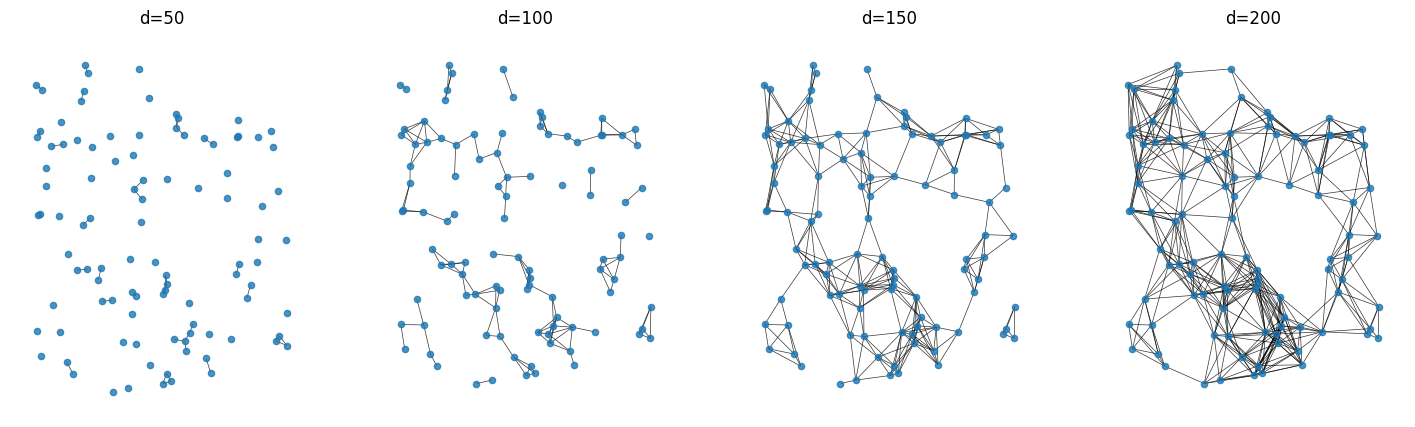
Varying distance thresholds for creating edges.
Here is the code for this example:
gdf = random_geodataframe(100, bounds=[1,1,1000,1000])
fig,ax=plt.subplots(1,4,figsize=(18,5))
axs=ax.flat
i=0
for d in [50,100,150,200]:
    G,pos = geodataframe_to_graph(gdf, d=d)
    nx.draw(G,pos,node_size=20,width=0.5,alpha=0.8,ax=axs[i])
    axs[i].set_title('d=%s' %d)
    i+=1