Introduction
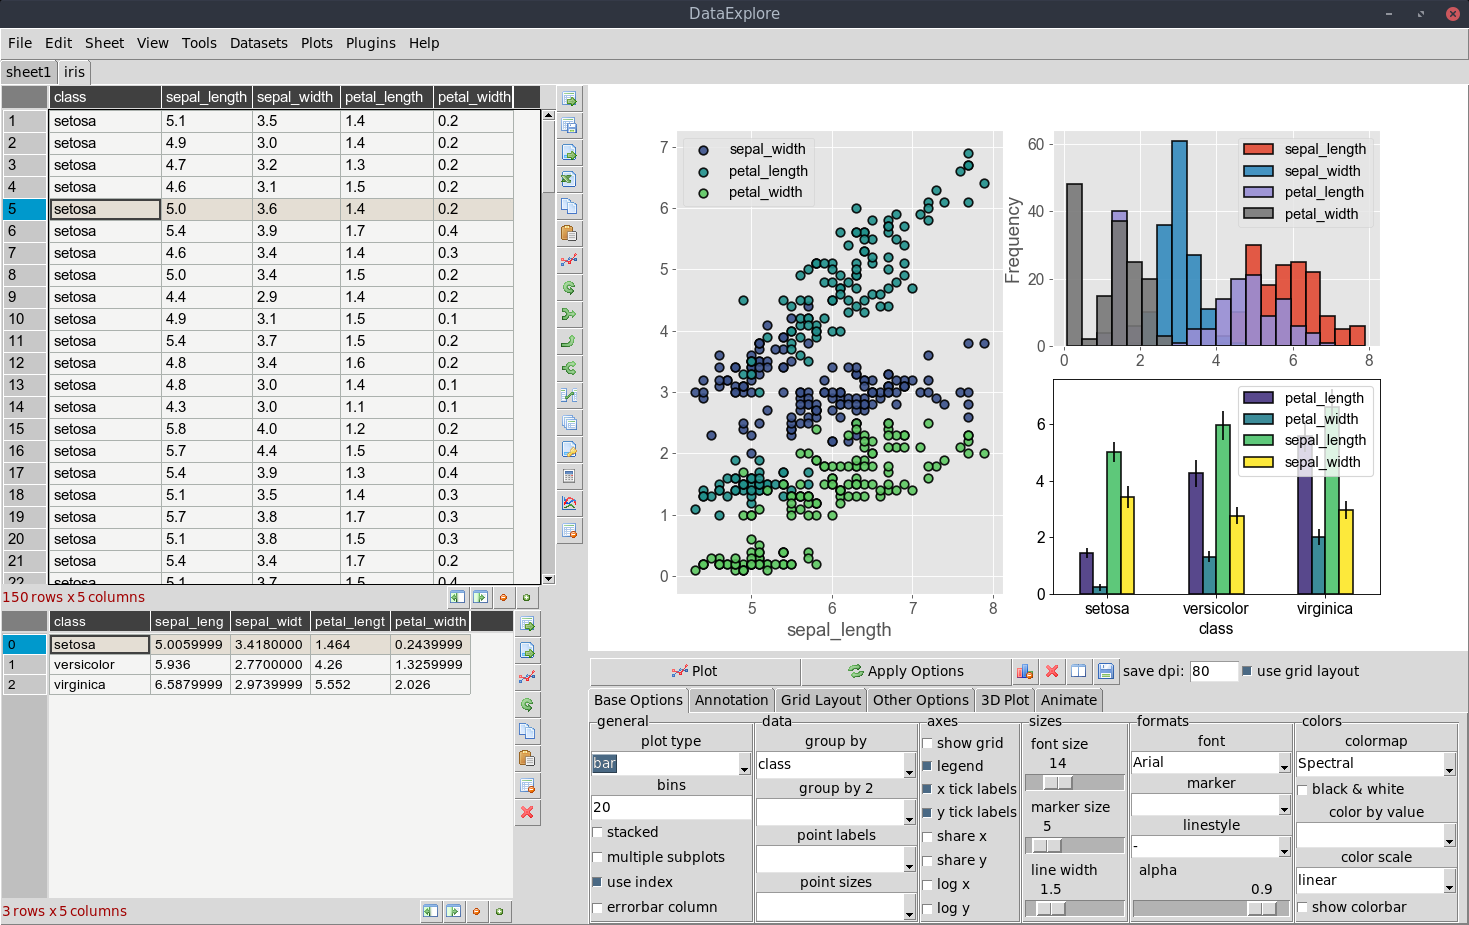
This application is intended for educational/scientific use and allows quick visualization of data with convenient plotting. The primary goal is to let users explore their tables interactively without any prior programming knowledge and make interesting plots as they do this. One advantage is the ability to load and work with relatively large tables as compared to spreadsheets. The focus is on data manipulation rather than data entry. Though basic cell editing and row/column changes are supported. The program is free and open source. It is based on a Python widget called pandastable which itself is a graphical frontend to the pandas DataFrame class.
Current features
- spreadsheet-like interface for table manipulation
- table analysis tools such as groupby-combine, pivot, merge, join and concatenate
- basic table formatting such as font, cell color, text size and column width
- import/export of supported text files
- rendering of large tables is possible
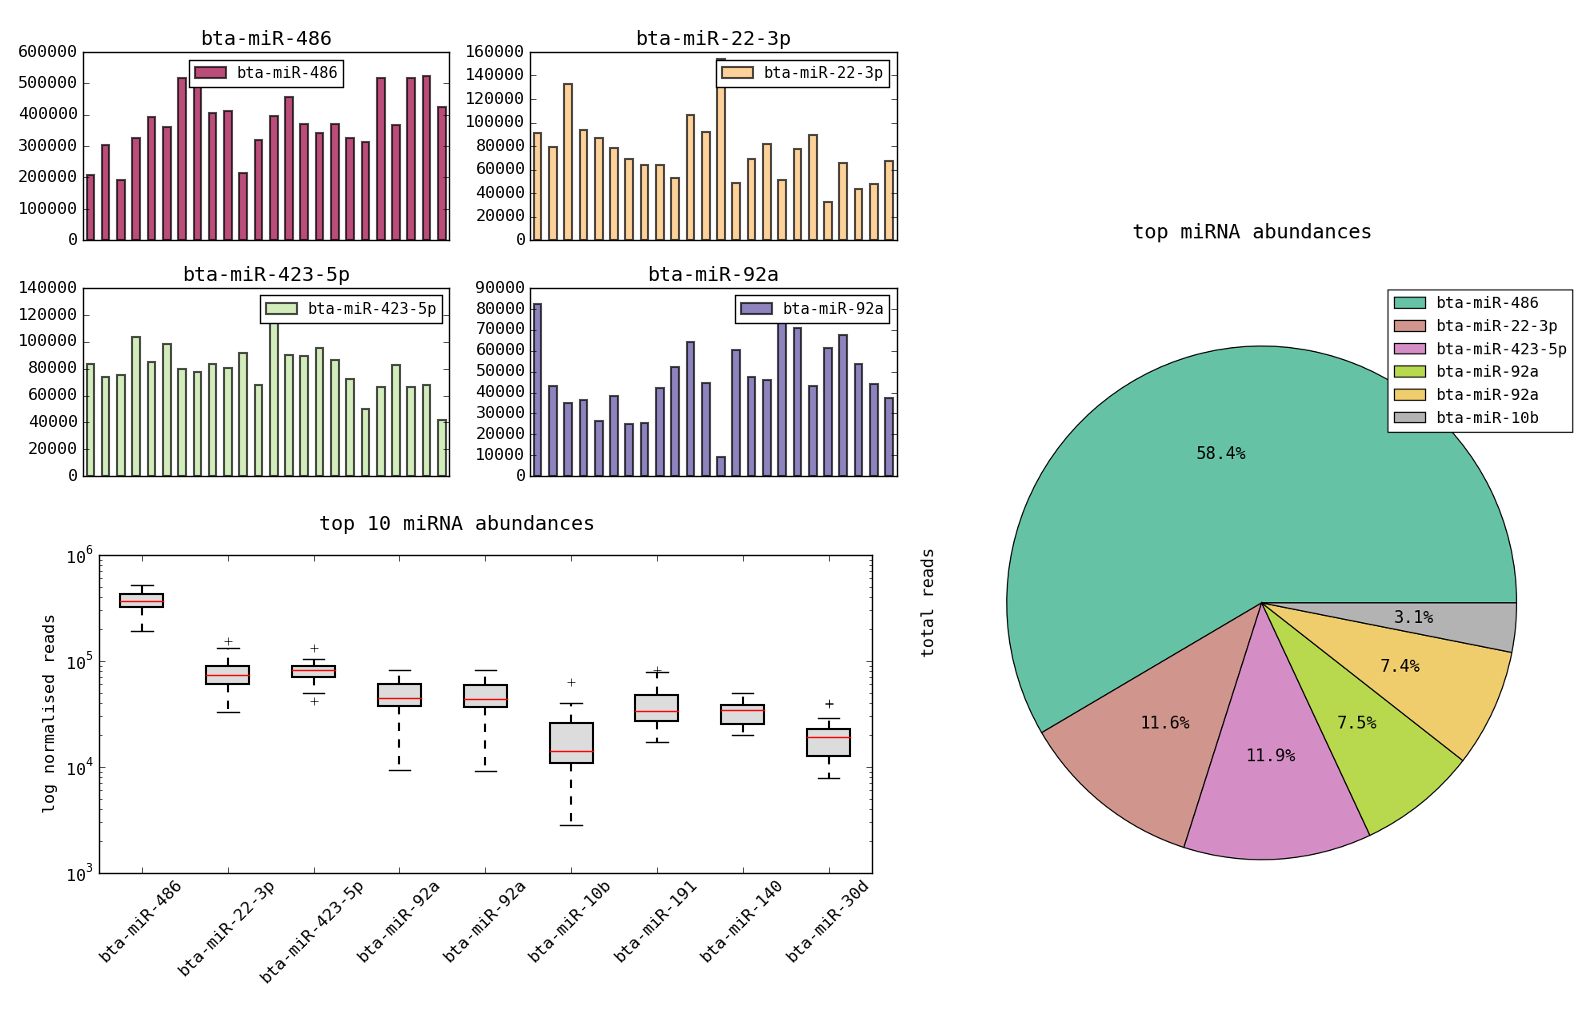
- advanced plotting with a simple interface
- data cleaning tools
- table filtering with dialog and/or boolean string
- plugins to add extra functionality such as factor plotting
Installation
- Windows: Just download and run the installer.
- Linux: Follow the instructions. You can then run the command 'dataexplore' from the command line.
- OSX: The linux instructions should work. pip is recommended.
Future possible features
- animated plotting e.g. time series data
- saving workflows