Plot and colour a minimum spanning tree with networkx
Background
A Minimum Spanning Tree (MST) is a concept from graph theory. Given a connected, undirected graph with weighted edges, an MST is a subset of the edges that connects all vertices together, without any cycles, and with the minimum possible total edge weight. While MSTs and phylogenetic trees both deal with the concept of connecting nodes in a graph, their purposes are different. Phylogenetic Trees represent evolutionary relationships among species or genes and have a root (representing a common ancestor) and branches (representing divergence). MSTs connect a set of points and do not represent evolutionary paths or divergence explicitly. While MSTs are not typically used to represent phylogenetic relationships in the traditional sense, they can be useful for showing genetic relatioships based on pairwise distance metrics. Visualizing genetic relationships in a network format rather than a strict tree format can sometimes be more intuitive.
Code
import pylab as plt
import numpy as np
import pandas as pd

def make_legend(fig, colormap, loc=(1.05, .6), title='',fontsize=12):
    """Make a figure legend wth provided color mapping"""

    import matplotlib.patches as mpatches
    pts=[]
    for c in colormap:
        pts.append(mpatches.Patch(color=colormap[c],label=c))
    fig.legend(handles=pts,bbox_to_anchor=loc,fontsize=fontsize,title=title)
    return pts

def get_color_mapping(df, col, cmap=None, seed=1):
    """Get random color map for categorcical dataframe column"""

    c = df[col].unique()
    if cmap == None:
        rcolors = random_colors(len(c),seed)
    else:
        cmap = mpl.cm.get_cmap(cmap)
        rcolors = [cmap(i) for i in range(len(c))]
    colormap = dict(zip(c, rcolors))
    newcolors =  [colormap[i] if i in colormap else 'Black' for i in df[col]]
    return newcolors, colormap

def dist_matrix_to_mst(distance_matrix, df=None, colorcol=None, labelcol=None, colormap=None,
                       cmap_name='Set1', node_size=4, font_size=6, with_labels=False,
                       edge_labels=False, legend_loc=(1, .7), ax=None):
    """
    Dist matrix to minimum spanning tree
    Args:
        distance_matrix: matrix as dataframe
        df: meta data with index corresponding to node names of tree
        colorcol: column in meta table to color nodes by
        labelcol: column in meta table to label nodes by
        colormap: a mapping of node names to colors
        cmap_name: name of an mpl colormap to apply instead of providing colormap
        node_size: size of nodes
        with_labels: whether to plot labels on nodes
        legend_loc: location of legend
    """

    if ax == None:
        fig,ax=plt.subplots()
    import networkx as nx
    from networkx.drawing.nx_agraph import graphviz_layout

    G = nx.Graph()

    for i, row in distance_matrix.iterrows():
        for j, weight in row.items():
            G.add_edge(i, j, weight=weight)

    T = nx.minimum_spanning_tree(G, algorithm='kruskal')
    # Compute edge lengths based on distances
    edge_lengths = [T[u][v]['weight'] for u, v in T.edges()]
    # Plot the minimum spanning tree with edge lengths proportional to distances
    pos = graphviz_layout(T)
    labels = nx.get_edge_attributes(T, 'weight')
    if df is not None:
        l = [label for label in T.nodes if label in df.index]
        df = df.loc[l]
        if colormap is None:
            colors,cmap = get_color_mapping(df, colorcol, cmap_name)
        else:
            #custom colormap if provided
            colors = [colormap[i] if i in colormap else 'black' for i in df[colorcol]]
            cmap = colormap
        #print (cmap)
        C = dict(zip(df.index, colors))
        node_colors = [C[node] if node in C else 'Black' for node in T.nodes()]
        #checks that colormap matches nodes so legend doesn't have crap in it
        cmap = check_keys(cmap, df[colorcol].unique())
        #add legend for node colors
        p = make_legend(ax.figure, cmap, loc=legend_loc, title=colorcol,fontsize=9)

    else:
        node_colors = 'black'
    nx.draw_networkx(T, pos, node_color=node_colors, node_size=node_size,
                     font_size=font_size, with_labels=with_labels, ax=ax)
    if edge_labels == True:
        nx.draw_networkx_edge_labels(T, pos, edge_labels=labels, font_size=font_size*.7, ax=ax)

    if labelcol not in [None,'']:
        node_labels = {node:df.loc[node][labelcol] if node in df.index else '' for node in T.nodes()}
        #print (node_labels)
        nx.draw_networkx_labels(T, pos, labels=node_labels, font_size=font_size,
                 horizontalalignment='right',verticalalignment='top')
    ax.axis('off')
    return T, pos
Here is some code to make test matrix and meta data:
def generate_distance_matrix(n, dim=4):
    from scipy.spatial import distance_matrix

    # Generate random coordinates in a latent space
    coordinates = np.random.rand(n, dim)
    # Compute the pairwise distances between the coordinates
    dist_matrix = distance_matrix(coordinates, coordinates)
    # Create row and column labels
    labels = [f"item{i+1}" for i in range(n)]
    # Convert the matrix to a pandas DataFrame
    distance_df = (pd.DataFrame(dist_matrix, index=labels, columns=labels)*10).round(1)
    return distance_df

def generate_random_metadata(names):
    import random
    # Define possible values for the metadata fields
    countries = ['Ireland', 'UK', 'USA', 'Canada', 'Australia']
    codes = ['A', 'B', 'C', 'D', 'E']
    years = list(range(2000, 2025))
    # List to store metadata for each name
    metadata = []
    for name in names:
        # Randomly select values for the metadata fields
        country = random.choice(countries)
        code = random.choice(codes)
        year = random.choice(years)
        # Append the metadata as a dictionary
        metadata.append({
            'name': name,
            'country': country,
            'code': code,
            'year': year
        })
    # Convert the list of metadata dictionaries to a pandas DataFrame
    metadata_df = pd.DataFrame(metadata).set_index('name')
    return metadata_df
Usage
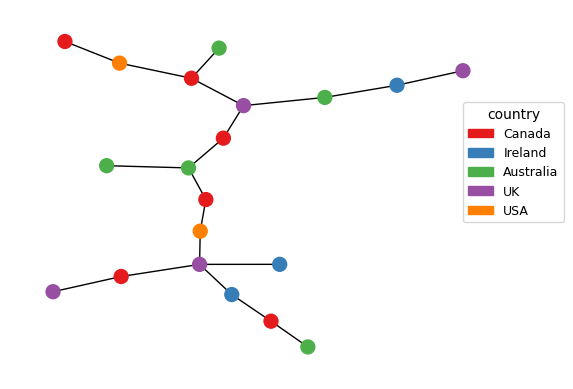
Simple plot
dm = generate_distance_matrix(20)
meta = generate_random_metadata(dm.index)
T,pos=dist_matrix_to_mst(dm, meta, 'country', node_size=100)
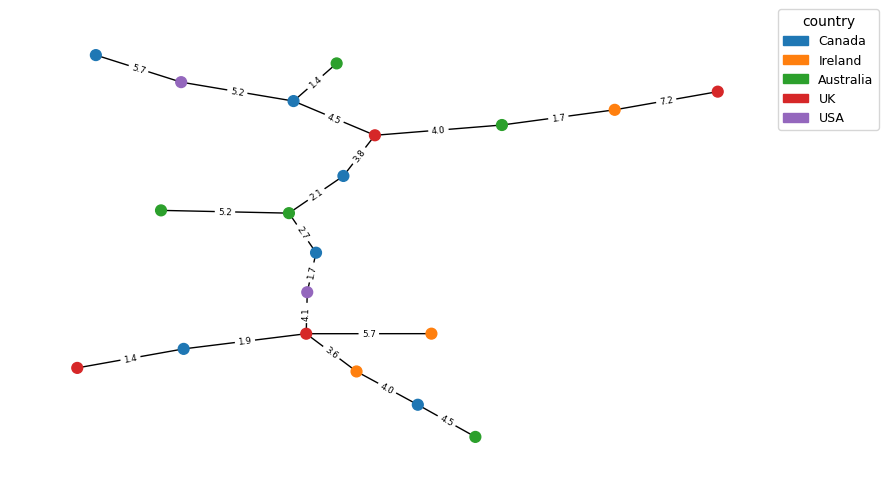
Add edge labels
fig,ax=plt.subplots(1,1,figsize=(10,6))
T,pos = dist_matrix_to_mst(dm,meta,colorcol='country',cmap_name='tab10',edge_labels=True,font_size=9,
                                 node_size=60,legend_loc=(1,.9),ax=ax)
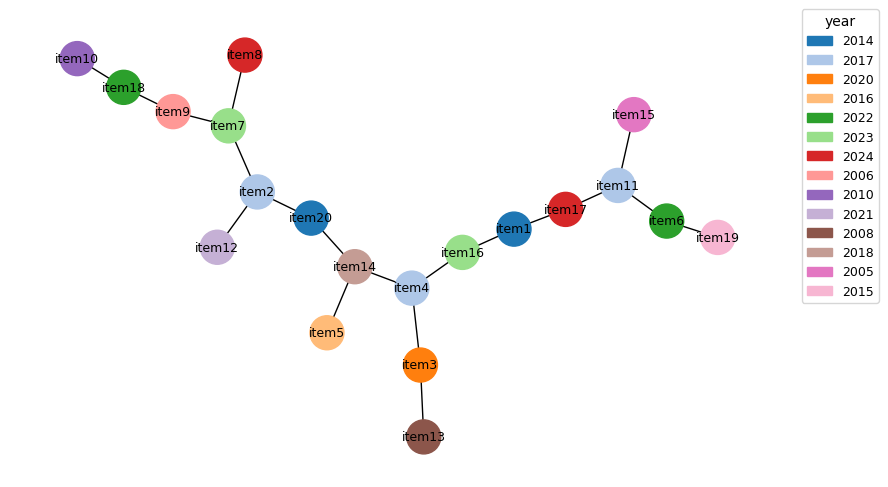
Add node labels
T,pos = dist_matrix_to_mst(dm,meta,colorcol='year',cmap_name='tab20',with_labels=True,font_size=9,
                                 node_size=600,legend_loc=(1,.9),ax=ax)
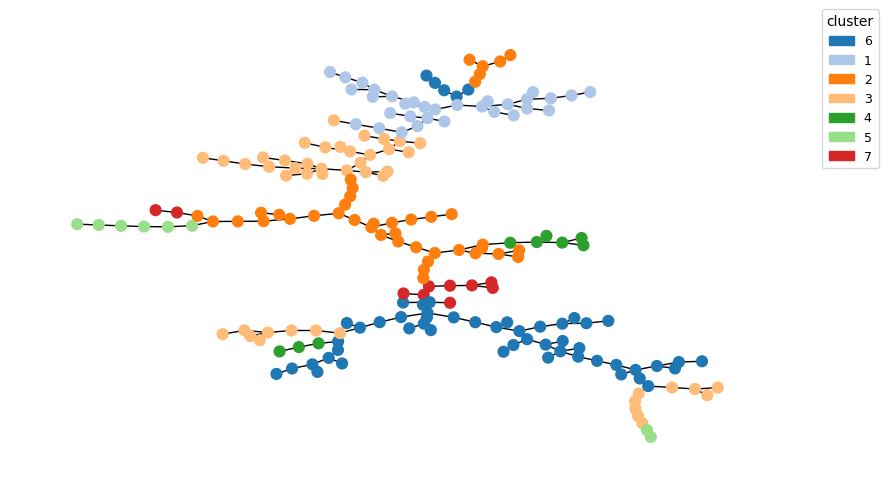
Clustering
Finally, let’s illustrate the relationship between clustering and tree visualization. Visualizing an MST shows the shortest paths to connect all nodes. The MST algorithm (e.g., Kruskal’s or Prim’s) selects edges based on the minimum weights without regard to the global structure of clusters. This can result in nodes that are close in distance but part of different local structures being connected in the MST. You can see this below when we apply labels from hierarchical clustering and plot them. It is useful to keep in mind.
def dm_cluster(distance_matrix, t, linkage='average'):
    from sklearn.cluster import AgglomerativeClustering
    clustering = AgglomerativeClustering(distance_threshold=t, n_clusters=None,
                                         linkage=linkage, metric='precomputed').fit(distance_matrix)
    labels = clustering.labels_+1
    clusters = pd.DataFrame(labels,columns=['cluster'],index=distance_matrix.index)
    return labels, clusters

labels,cl = dm_cluster(dm, 7)
meta['cluster'] = labels
#now color by cluster label
T,pos = dist_matrix_to_mst(dm,meta,colorcol='cluster',cmap_name='tab20',
                                 node_size=40,legend_loc=(1,.9))
Links
- https://networkx.org/