Epitopemap
A web application for visualizing MHC binding predictions
Table of Contents
Background
This is a web interface for running and visualising epitope predictions (currently MHC binding) and allow integrated analysis for entire proteomes. The app is designed to address the limitations of current web servers for epitope prediction. Limits on the sequence size which can be submitted to website servers generally only allows single protein analysis and thus precludes integrated analysis for a whole proteome.This application is built on the web2py platform. This manual does not give many web2py details since the application is meant to be usable without knowledge of the framework. Advanced users can consult the web2py book for details.
Basics
Submission page
The binding predictions are made by submitting jobs via the submission form. Several prediction methods can be chosen and will be run in turn. Once the submit buttone is pressed the user is directed to another page indicating the task id and status shown as QUEUED. The id is unique identifier for the job. Refreshing the page will show the task progress moving from ASSIGNED to RUNNING then COMPLETED once the job is done. This page can be retrieved if you know the job id with this URL:
Jobs are queued and run in the background using the web2py scheduler system and are run consecutively. However it is possible to create multiple workers when web2py is started and thus multiple queues. You could do this if you are using a computer with multiple processors and want to make better use of them.
The time taken to run predictions depends on the number of alleles, number of proteins and the prediction method. Tepitope is fastest and will take 15-20 minutes to do a genome with ~4000 proteins for each allele. NetMHCIIpan will be noticeably slower and may take several hours.
Prediction methods
There are many MHC binding (T cell), B cell and other predictors available. Those currently supported by this application are due to their popularity and reliability. We primarily focus on MHC binding prediction at this time.The Tepitope method is our own Python implementation of TEPITOPEPan and requires no external program to run. netMHCIIpan must be downloaded separately from the website and installed on your system. The process is quite simple. The same applies for the IEDB tools. Both of these tools are free for academic use but we do not distribute them with this app. Remember that this app is designed as an integrated way to use these tools but is not meant to replace them in all respects. The netMHCIIpan server at the CBS should be consulted for some more detailed options on using that program. Here are the available methods with download links for external tools:
Selection of alleles
Selection of which alleles to run will be entirely dependent upon the end results required. Users must have a particular goal in mind when making predictions. Simply using all alleles will NOT be helpful and will be very slow since there are so many human alleles.
Some alleles are not available for all methods and will be ignored for those methods. MHCII DP and DQ alleles are for netMHCIIpan only.
How predictions are stored
Storage of results uses a fairly simple method. Results run via the web app are simply added to the database recording the identifier only. All results data are then stored according to the label/identifier with one directory per genome and then a folder for each prediction method. Inside this is a file for each protein predicted as follows. Each file is stored in MessagePack format, which is a binary format for efficient storage). Data is stored in this way so that results can be quickly loaded for a specific protein. Inside each file is a Python data structure storing the scores for every peptide/allele in that protein. Example:
../static/results/identifier/genome/method/locus_tag.mpk
e.g:
../static/results/testresults/Mbovis/tepitope/Mb0012.mpk
This example is for tepitope prediction data for the protein Mb0012 in Mbovis. All results are stored in the static/results folder of the web application.
Adding sequences
Before predictions you need to add your proteins/proteome to the application. Annotated protein sequences can currently be added by two methods:
Genbank format (preferred method)
Genbank is used for reasons of consistency and completeness. The locus tag in the genbank format for each protein is usually a unique identifier and short unlike the description field that might be extracted from a fasta file. Genbank files contain features such as gene product or location that are also useful for identifying the protein. Genbank format files for an organism can be found on the NCBI genomes page or downloaded via ftp.
Fasta format
(Choose 'Add protein sequences' from the menu).Any collection of sequences contained in a fasta file can be added. They do not have to be related in any way but might represent some subset of a genome or a collection of orthologs. This method relies on correct naming for the each sequence in the description line so is not as reliable as the genbank format. However it is probably more familiar to users. Any sequences added in this way are assigned to the genome 'other'.
The program will use the locus tags in the genbank file for each protein. If these are not available the gene names are used as locus tags. For fasta inputs the identifier following the ">" is used. Genbank format is recommended since fasta files can have non-standard or confusing ids like gi|31563518|ref|NP_852610.1| which is not very user friendly. Fasta files do not contain features present in genbank format such as gene product or location that can be useful for identifying the protein. Improperly formatted fasta files may not work well.
Viewing predictions
Every set of predictions for a genome (or maybe just a group of protein sequences) has an identifier associated with it. This is simply a string identifying a set of binding predictions run with the same parameters, e.g. a specific set of alleles. This 'prediction id' simply groups your predictions together in the same folder and can be helpful to separate your predictions from another set if you are working on the same proteins. So if you want a different set of predictions for the same proteins then create a new label/id.
Quick search
This form on the home page allows you to get a quick preview and see if a particular protein is present and has some predictions made. If there are results available a small plot will be displayed in the page. Either the locus tag or gene name can be used but only the tag is unique. If there are proteins with the same gene name in the source annotation then only the first one is used here. The gene name overrides the locus tag in this form.Quick view
This is the usual interface for viewing results. It consists of a form on the left side which updates the results on the right panel of the page when the 'update' button is pressed. The id,genome and required protein tag must all be entered correctly.Binding prediction plots
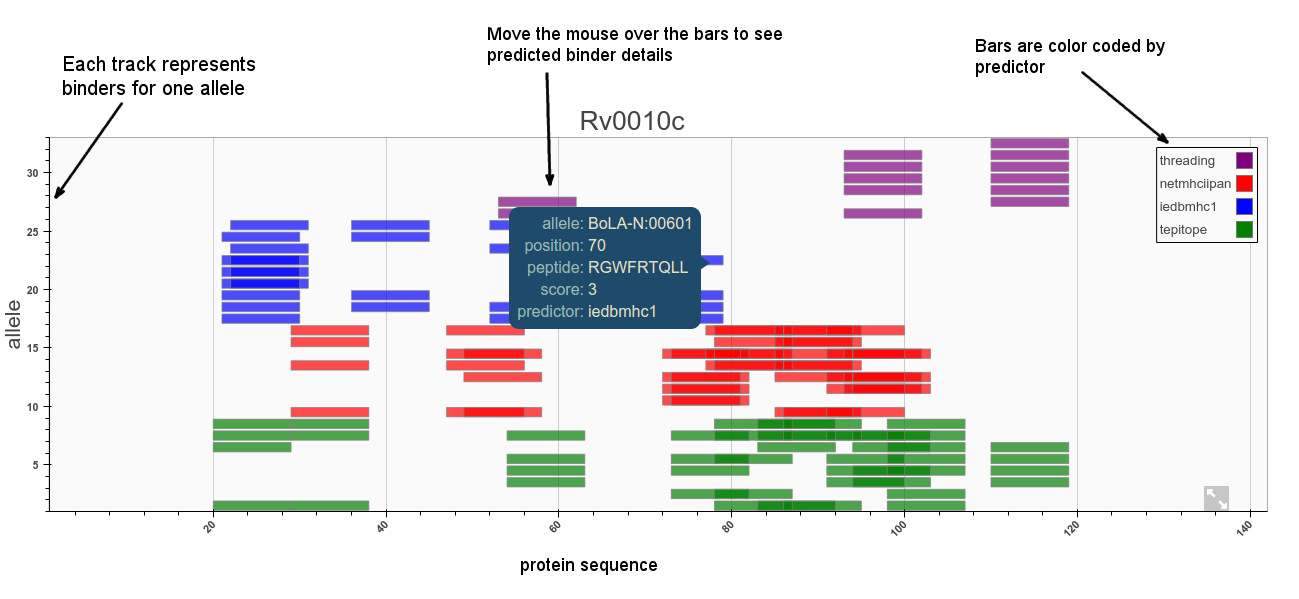
Predictors will usually make multiple scoring predictions for each allele for an n-mer set of binders. This information can be hard to display in a single plot. The purpose of the plot is to allow the user to quickly visualise where epitopes might be along the sequence and compare all alleles and different methods in one plot. The default representation is a set of tracks with bars representing predicted binders for each allele ordered by position on the sequence as shown below. Plots can be zoomed in and out and panned left right.
Cut-offs/thresholds
Selection of predicted binders can be done based on the percentile rank or MHC binding affinity (or whatever score is a proxy for binding). It has also been shown that absolute binding affinity threshold correlates better with immunogenicity and MHC allele-specific thresholds should be used to improve correlations. For MHC-II the IEDB currently recommends making selections based on a consensus percentile rank of the top 10%. See this iedb help page for more information.Using fixed URIs
The protein URIs are structured so that they can be entered in the address bar if required. However the easiest way to find and view predictions for a known protein name is via the quickview page which has form for entering the protein details and a few other options.
Searching for a protein
This is done through the search page and is a simple form. Here you can enter keywords like gene name to identify proteins of interest from the genome and get the correct locus tag(s) to be used in the quickview page etc.Genome wide analysis
This page performs an analysis of all proteins to find the top binders found in n alleles. A global percentage cutoff can also be chosen. This allows a quick overview of the proteins with highest percentage of binders and those with epitopes that cluster together. The result is a table that can be sorted according to various metrics such as the number of binders per unit length of each protein or the number and density of epitope clusters.
Explanation of results table columns:
Two additional tables showing the top peptides and clusters are also produced.
Epitope conservation analysis
This interface allows you to get an estimate of how well conserved a predicted epitope is across a given set of sequences at a certain identity level.
Orthologs for the sequence are first retrieved using an online blast. This can take up to several minutes but results are saved for later use. Once the alignments are returned the conservation of each epitope can be calculated. This is defined as the percentage of sequences where the epitope is present out of the total aligned. The set of sequences can be chosen based on a desired identity cutoff or taxon specification. For example, the sequences may constitute all orthologs within a bacterial species or just a set of strains.
Results
Results are given as a table of all binders with >n alleles and their percentage conservation at that identity level. In addition a plot showing the variation of this value with cutoff identity gives an indication of how well an epitope is conserved across species/strains. This will be context dependent.
BLAST options
Our method uses the NCBI online Blast service to retrieve orthologous matches. By default all matches are retrieved with an expect value lower than 10 and the sequences can then be filtered by percentage identity. It may be preferable or necessary to refine blast queries to narrow down the sequence set to a specific taxon or species.This can be done using the entrez query text box (empty by default). This restricts the search to a subset of entries from the nr protein database fitting the requirement of the Entrez query. For example, to restrict the results to Actinobacteria we would use: txid201174[ORGN]. See this page for more information.
The following field names may be useful:
Example
Using the uploaded zaire-ebolavirus data on the public server (http://enzyme.ucd.ie:8080) we can show some examples. Prediction data is available under the 'test' id already for this genome. locus tag/gene names for this small genome can be viewed at this link Or use the search feature. This shows that there are three genes called GP and that using the locus tag is needed to identify them properly.Going to Quickview and entering the gene name 'NP' (ZEBOVgp1) (remember id='test') will show the epitopes for this gene. This shows a cluster of epitopes at position 194-199 for example. This covers the peptide 'GHMMVIFRLMRTNFLI'. Conservation analysis will show that the binder 'HMMVIFRLMRT' is highly conserved. This kind of analysis can be applied to other proteins and the results compared to known epitopes. See the following pages on the IEDB for more reference:
Administration
Paths to binaries
The IEDB tools and/or netMHCIIpan distributions are required to be installed locally for the web application to use them. To ensure that these programs can be found you can the path to the install folders here.Add/remove genomes
See the instructions for adding sequences above.Add/remove predictions
A row with the identifier is added to the database whenever a set of predictions is submitted with a new id. Therefore this menu is normally only used to delete old predictions. Old results should then be deleted manually from the filesystem.Starting the server
The most simple way to run the application is to use the built-in rocket server. Non-root users will have problems running the server on 'priviledged' ports (over 1024) so we recommend using a high port like 8000 and running as your own user. It is possible to run as root using sudo but not recommended. The server is started by typing the following command from inside the web2py folder:-i is the web address
-p is the port
-K specifies the app for the scheduler
-a is the admin password
For servers with a high traffic production environment it is possible to deploy web2py behind Apache. Advanced users can consult the deployment recipes in the web2py book.
Security
We2py provides a built in system for user accounts and allows authorization to be done on a page basis. Currently users need to log in to submit and view predictions. New users can register via the home page and as admin user you can grant access.Installation
This application has been built and tested on the Ubuntu Linux operating system (versions 14.04/15.04). web2py and the required Python dependencies are also available on both Windows and Mac OSX also though these have not been fully tested yet. We therefore currently recommend running this web app on a linux OS. Follow these steps:
Python dependencies
Setup currently requires you to install the Python libraries yourself. This is a cleaner approach than providing them with the application and is now fairly simple on linux. If there is a problem installing the packages with apt-get you can use pip or vice versa. Note that bokeh (used for plots) has quite a few dependencies but they will all be installed with pip automatically, so don't worry if you see a lot of messages appearing.On Ubuntu type the following on the command line to install the Python modules:
sudo pip install numpy pandas biopython bokeh mpld3
#or
sudo apt-get install python-numpy python-pandas python-matplotlib