A network agent based infection model with Mesa
Background
A previous post looked at using agent based models to simulate many individual ‘agents’ in the population for modelling infection spread. It used the Mesa Python library to build an SIR model and also illustrates ways of visualizing the simulation as the model is run using Bokeh. Here we perform the same task but use a network grid instead. This is probably a more realistic type of model when used correctly. This code is suitable to run in a Jupyter notebook. The code is here. It uses the Mesa Virus on a Network example as a guide.
Imports
import time, enum, math
import numpy as np
import pandas as pd
import pylab as plt
from mesa import Agent, Model
from mesa.time import RandomActivation
from mesa.space import NetworkGrid
from mesa.datacollection import DataCollector
import networkx as nx
Building the model
The main idea with Mesa is to create two classes, one for the model and the other for the agents. The agent handles the behaviour of the individual being simulated such as how it can infect other neighbours in a grid or network. This is explained more in the previous post. Making the agent first is quite similar to the last time, but with some changes to the contact method since the grid properties are different.
class MyAgent(Agent):
    """ An agent in an epidemic model."""
    def __init__(self, unique_id, model):
        super().__init__(unique_id, model)
        self.age = int(self.random.normalvariate(20,40))
        self.state = State.SUSCEPTIBLE
        self.infection_time = 0

    def move(self):
        """Move the agent"""

        possible_steps = [
            node
            for node in self.model.grid.get_neighbors(self.pos, include_center=False)
            if self.model.grid.is_cell_empty(node)
        ]
        if len(possible_steps) > 0:
            new_position = self.random.choice(possible_steps)
            self.model.grid.move_agent(self, new_position)

    def status(self):
        """Check infection status"""

        if self.state == State.INFECTED:
            drate = self.model.death_rate
            alive = np.random.choice([0,1], p=[drate,1-drate])
            if alive == 0:
                self.model.schedule.remove(self)
            t = self.model.schedule.time-self.infection_time
            if t >= self.recovery_time:
                self.state = State.REMOVED
            #print (self.model.schedule.time,self.recovery_time,t)

    def contact(self):
        """Find close contacts and infect"""

        neighbors_nodes = self.model.grid.get_neighbors(self.pos, include_center=False)
        susceptible_neighbors = [
            agent
            for agent in self.model.grid.get_cell_list_contents(neighbors_nodes)
            if agent.state is State.SUSCEPTIBLE
        ]
        for a in susceptible_neighbors:
            if self.random.random() < model.ptrans:
                a.state = State.INFECTED
                a.recovery_time = model.get_recovery_time()

    def step(self):
        self.status()
        self.move()
        self.contact()

    def toJSON(self):
        d = self.unique_id
        return json.dumps(d, default=lambda o: o.__dict__,
            sort_keys=True, indent=4)
Now instead of using a MultiGrid class, here we use the NetworkGrid class to make the model. This also requires NetworkX.
class NetworkInfectionModel(Model):
    """A model for infection spread."""

    def __init__(self, N=10, ptrans=0.5, avg_node_degree=3,
                 progression_period=3, progression_sd=2, death_rate=0.0193, recovery_days=21,
                 recovery_sd=7):

        #self.num_agents = N
        self.num_nodes = N
        prob = avg_node_degree / self.num_nodes

        self.initial_outbreak_size = 1
        self.recovery_days = recovery_days
        self.recovery_sd = recovery_sd
        self.ptrans = ptrans
        self.death_rate = death_rate

        self.G = nx.erdos_renyi_graph(n=self.num_nodes, p=prob)
        self.grid = NetworkGrid(self.G)

        self.schedule = RandomActivation(self)
        self.running = True
        #self.dead_agents = []

        # Create agents
        for i, node in enumerate(self.G.nodes()):
            a = MyAgent(i+1, self)
            self.schedule.add(a)
            #add agent
            self.grid.place_agent(a, node)

            #make some agents infected at start
            infected = np.random.choice([0,1], p=[0.99,0.01])
            if infected == 1:
                a.state = State.INFECTED
                a.recovery_time = self.get_recovery_time()

        self.datacollector = DataCollector(
            agent_reporters={"State": "state"})

    def get_recovery_time(self):
        return int(self.random.normalvariate(self.recovery_days,self.recovery_sd))

    def step(self):
        self.datacollector.collect(self)
        self.schedule.step()
Run the model
We can now run the model by simply iterating over the number of steps we want. This was detailed previously.
model = NetworkInfectionModel(300, ptrans=0.2)
for i in range(steps):
    model.step()
Plot the grid
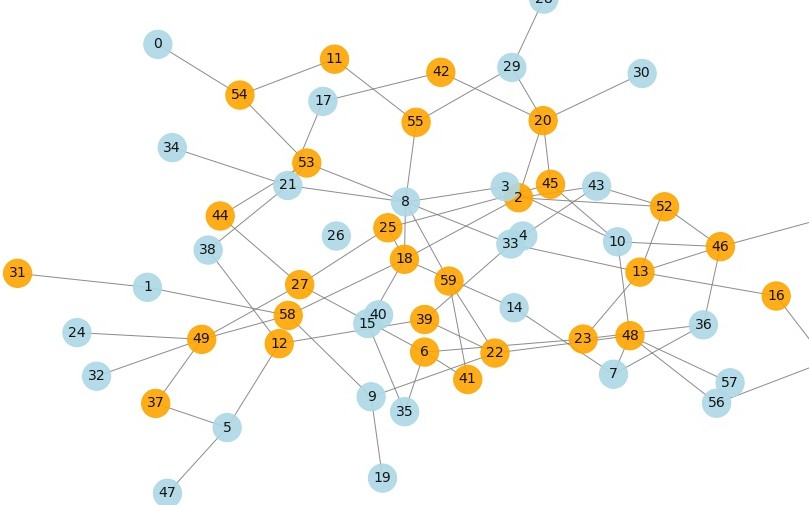
We can plot the network using networkx and matplotlib. First a layout is selected and the nodes positioned on it with links between them (the edges). Then the states are read from the current model step and the nodes colored according to their state. This way we can see how spread is occuring.
from matplotlib.colors import ListedColormap, LinearSegmentedColormap
cmap = ListedColormap(["lightblue", "orange", "green",])

def plot_grid(model,fig,layout='spring',title=''):
    graph = model.G
    if layout == 'kamada-kawai':
        pos = nx.kamada_kawai_layout(graph)
    elif layout == 'circular':
        pos = nx.circular_layout(graph)
    else:
        pos = nx.spring_layout(graph, iterations=5, seed=8)
    plt.clf()
    ax=fig.add_subplot()
    states = [int(i.state) for i in model.grid.get_all_cell_contents()]
    colors = [cmap(i) for i in states]

    nx.draw(graph, pos, node_size=100, edge_color='gray', node_color=colors, #with_labels=True,
            alpha=0.9,font_size=14,ax=ax)
    ax.set_title(title)
    return

#example usage
fig,ax=plt.subplots(1,1,figsize=(16,10))
model = NetworkInfectionModel(60, ptrans=0.1)
model.step()
f=plot_grid(model,fig,layout='kamada-kawai')
Control options with Panel widgets
Finally we can use these plot functions to show the model data as it runs by using Panel widgets. We also add some controls for the options. run_model is called when we press the run button. Note that every time we refresh new axes are added to the figures. plot_states uses the same code as last time.
def run_model(pop, ptrans, degree, steps, delay, layout):

    model = NetworkInfectionModel(pop, ptrans=ptrans, avg_node_degree=degree)

    fig1 = plt.Figure(figsize=(8,6))
    grid_pane.object = fig1
    fig2 = plt.Figure(figsize=(8,6))
    ax2=fig2.add_subplot(1,1,1,label='b')
    states_pane.object = fig2

    #step through the model and plot at each step
    for i in range(steps):
        model.step()
        plot_grid(model,fig1,title='step=%s' %i, layout=layout)
        grid_pane.param.trigger('object')
        ax2.clear()
        plot_states(model,ax2)
        ax2.set_xlim(0,steps)
        states_pane.param.trigger('object')
        time.sleep(delay)
    plt.clf()

grid_pane = pn.pane.Matplotlib(plt.Figure(),width=500,height=400)
states_pane = pn.pane.Matplotlib(plt.Figure(),width=400,height=300)
go_btn = pnw.Button(name='run',width=100,button_type='primary')
pop_input = pnw.IntSlider(name='population',value=100,start=10,end=1000,step=10,width=100)
ptrans_input = pnw.FloatSlider(name='prob. trans',value=0.1,width=100)
degree_input = pnw.IntSlider(name='node degree',value=3,start=1,end=10,width=100)
steps_input = pnw.IntSlider(name='steps',value=20,start=5,end=100,width=100)
delay_input = pnw.FloatSlider(name='delay',value=.2,start=0,end=3,step=.2,width=100)
layout_input = pnw.Select(name='layout',options=['spring','circular','kamada-kawai'],width=100)
widgets = pn.WidgetBox(go_btn,pop_input,ptrans_input,degree_input,steps_input,delay_input,layout_input)

def execute(event):
    #run the model with widget options
    run_model(pop_input.value, ptrans_input.value, degree_input.value,
              steps_input.value, delay_input.value, layout_input.value)
go_btn.param.watch(execute, 'clicks')

pn.Row(pn.Column(widgets),grid_pane,states_pane,sizing_mode='stretch_width')
The final output is shown below.

References
- S. Venkatramanan, B. Lewis, J. Chen, D. Higdon, A. Vullikanti, and M. Marathe, “Using data-driven agent-based models for forecasting emerging infectious diseases,” Epidemics, vol. 22, pp. 43–49, 2018.