Posts
Plot a phylogenetic tree with bokeh and biopython
25 October 2024
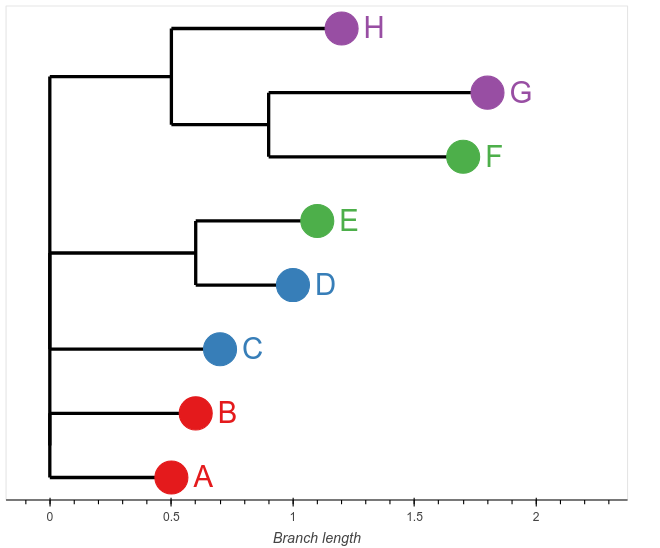
Bokeh can be used to make a wide variety of interactive plots. Here we use it to plot an interactive phylogenetic tree. We skip the more complicated part of tree drawing by using the Biopython Phylo module to read a newick tree and then get the tip coordinates from the tree object. From here it’s a simple matter of connecting the tips with the branches and adding labels and so on. This code accepts a dataframe with metadata for the...
Bacterial species identification from WGS using 16S genes
04 June 2024
The 16S rRNA gene is present in all bacteria and contains both highly conserved and hypervariable regions. The conserved regions allow for the design of universal primers that can amplify the gene across a wide range of bacteria and archaea. The hypervariable regions (e.g., V1-V9) provide species-specific sequences that can be used to distinguish between different taxa. This is a widely used means of species identification. With WGS we have the whole genome and relying on 16S alone is not...
Plot and colour a minimum spanning tree with networkx
31 May 2024
A Minimum Spanning Tree (MST) is a concept from graph theory. Given a connected, undirected graph with weighted edges, an MST is a subset of the edges that connects all vertices together, without any cycles, and with the minimum possible total edge weight. While MSTs and phylogenetic trees both deal with the concept of connecting nodes in a graph, their purposes are different. Phylogenetic Trees represent evolutionary relationships among species or genes and have a root (representing a common ancestor)...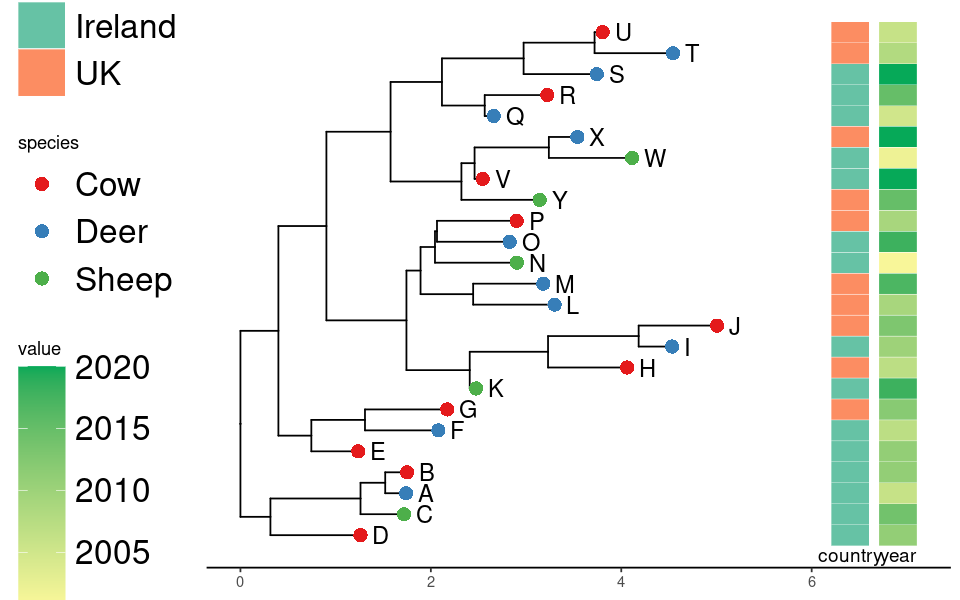
An updated convenience function for ggtree with heatmaps
30 May 2024
Previously we looked at a convenience function for drawing and colouring phylogenetic trees with ggtree. This post contains an updated version of this function with some improvements. Recall that the appropriate meta data is provided as a data.frame object with row names matching tip names of the tree. The first column in cols is used for the tip colors. You also need to provide corresponding cmap values for the colormaps. Numeric data is just coloured with a predefined gradient. This...
Calculate PubMLST sequence types using Python
29 March 2024
PubMLST, or Public databases for Molecular Typing and Microbial Genome Diversity, is a web-based platform that provides access to databases of microbial genetic sequences. It is primarily used for microbial typing, strain comparison, and epidemiological studies. The primary purpose of PubMLST is to facilitate the standardization and sharing of microbial sequence data. The databases hosted by PubMLST typically include sequence types (STs), allelic profiles, and sometimes additional metadata for each strain. Users can query the databases, submit their own sequences...
Two quick ways of building a bacterial species phylogeny
22 March 2024
Performing phylogenetic analysis with whole or core genome sequences maximizes the information used to estimate phylogenies and the resolution of closely related species. Usually sequences are aligned with a reference species or strain. However genome alignment is a process that does not scale well computationally. Even for small numbers of genomes it can be time consuming. Here are two relatively painless ways make a bacterial species phylogeny that you can do yourself. This might be useful if you are concerned...
Filtering a QTableView with QSortFilterProxyModel
28 January 2024
Qt is a popular GUI toolkit for writing desktop applications. It has bindings for Python using either PySide2 or PyQt5 (which use essentially identical syntax). QTableView is the default class for table representations. It uses a QAbstractTableModel as the data source class. These can be sub classed to use whatever data backend you want. Here is some code using a pandas DataFrame as the data source. It’s not actually essential for the example, but could be extended with more complex...
Finding genes in a genome or assembly with Python
21 January 2024
There are lots of tools for finding specific genes inside genome sequences. The well established technique is to blast the query gene sequence to your own (the target). You generally need to use some threshold of percentage identity and coverage of the sequence to filter results. Here is a method in Python that uses blast to search a genome sequence in a fasta file. The sequence can be anything like full genomes, assembly contigs or a short segment of sequence....
Fetch assemblies and associated biosample data using Entrez tools with Biopython
19 January 2024
This is a somewhat altered version of code from an old post for downloading assemblies. GenBank provides access to information on all it’s assembled genomes via the assembly database. You have several options: download assemblies individually or in bulk via the website or the Entrez database search system using command line tools without the website. The later is good for large automated searches/downloads. The BioPython package provides an interface to the entrez tools too. esearch - searches an NCBI database...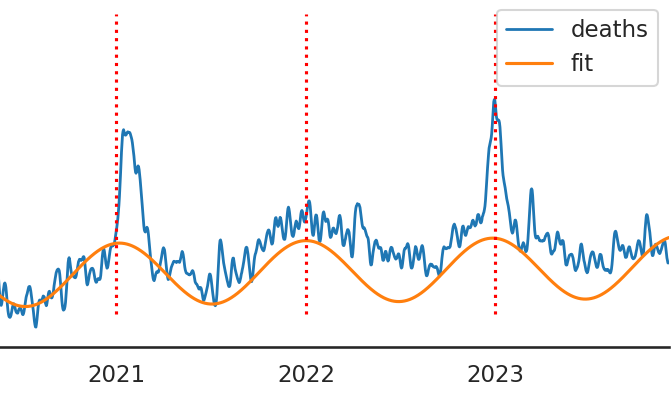
Excess mortality in Ireland still high in 2023
05 January 2024
Previously we have looked at potential excess deaths in Ireland using data retrieved from RIP.ie. These represent quite accurate real-time all-cause mortality estimates that are an alternative to the official GRO data which lag behind by many months. It appears that the unusually high mortality signal present since around the start of 2021 continues to the present (December 2023). Below are updated plots showing now including 2023 data. Note that below total deaths are used for the remaining analysis. Strictly...All posts
- 25 Oct 2024 » Plot a phylogenetic tree with bokeh and biopython
- 04 Jun 2024 » Bacterial species identification from WGS using 16S genes
- 31 May 2024 » Plot and colour a minimum spanning tree with networkx
- 30 May 2024 » An updated convenience function for ggtree with heatmaps
- 29 Mar 2024 » Calculate PubMLST sequence types using Python
- 22 Mar 2024 » Two quick ways of building a bacterial species phylogeny
- 28 Jan 2024 » Filtering a QTableView with QSortFilterProxyModel
- 21 Jan 2024 » Finding genes in a genome or assembly with Python
- 19 Jan 2024 » Fetch assemblies and associated biosample data using Entrez tools with Biopython
- 05 Jan 2024 » Excess mortality in Ireland still high in 2023
- 29 Dec 2023 » A Panel app for image-to-image generation
- 18 Dec 2023 » image-to-image with Stable Diffusion in Python
- 12 Nov 2023 » Speech diarization with OpenAI whisper and pyannote.audio
- 21 Sep 2023 » Condition Stable Diffusion images with ControlNet
- 19 Sep 2023 » AI art with Stable Diffusion in Python
- 15 Sep 2023 » SNP clustering and type naming of pathogens from WGS
- 18 Jun 2023 » A phylogenetic tree viewer with PyQt and ToyTree
- 22 Mar 2023 » Simulate land parcels and fragmentation with geopandas
- 19 Mar 2023 » An individual based model of farm pathogen spread with Python/Mesa
- 15 Mar 2023 » Make a contact network from a geopandas geodataframe
- 23 Jan 2023 » Make networkx Delaunay graphs from geopandas dataframes
- 14 Jan 2023 » Using Molecular Nodes in Blender to visualise proteins
- 29 Dec 2022 » Scrape dynamic tables in Python with Playwright
- 21 Dec 2022 » Can ChatGPT solve bioinformatic problems with Python?
- 19 Dec 2022 » DALLE-2 and AI generated art.
- 15 Oct 2022 » How to host your podcast with github
- 08 Sep 2022 » Excess mortality in Ireland is still high in 2022
- 13 Aug 2022 » Mapping the historical development of Tallaght
- 07 Aug 2022 » Plotting gridded quantitative data with geopandas - Irish forestry
- 04 Aug 2022 » Make regular grids from polygons with geopandas
- 02 Aug 2022 » Plot phylogenies with annotation in R using ggtree and gheatmap
- 10 Apr 2022 » Parallelize a function in Python that returns a pandas DataFrame
- 28 Mar 2022 » batchfilerename - A simple utility for batch file renaming
- 20 Mar 2022 » Using IGV inside Jupyter Lab notebooks
- 23 Feb 2022 » Scrape paginated tables in Python with beautifulsoup
- 29 Jan 2022 » Ireland mortality data from RIP.ie, updated for 2021
- 12 Jan 2022 » Pandemic restrictions have caused misery in low income countries
- 14 Nov 2021 » High vaccination rates don't prevent transmission of SARS-CoV-2
- 12 Nov 2021 » Seasonality of SARS-CoV-2
- 18 Oct 2021 » Bacterial SNP detection with nanopore vs. illumina sequencing
- 03 Sep 2021 » Natural immunity to SARS-CoV-2
- 10 Jul 2021 » Comparison of SNP detection using duplicate sequencing runs in SNiPgenie
- 19 Jun 2021 » wgMLST vs the reference-align-SNP-calling method for M.bovis
- 15 Jun 2021 » Deaths in Ireland from RIP.ie - another look
- 10 Jun 2021 » A whole genome MLST (wgMLST) implementation in Python
- 18 May 2021 » Viewing the THOR dataset with Bokeh and Panel
- 15 May 2021 » The scale of US bombing in Southeast Asia revealed in the THOR dataset
- 26 Feb 2021 » A phylogenetic tree viewer with Qt and Toytree
- 16 Feb 2021 » A simple GIS plugin for Tablexplore
- 28 Jan 2021 » Ireland deaths in 2019/2020 compared to previous years
- 25 Jan 2021 » Daily deaths in Ireland from RIP.ie in 2019 and 2020
- 20 Jan 2021 » Visualizing Irish girls names since 1970
- 15 Jan 2021 » M. bovis spoligotyping from WGS reads
- 11 Jan 2021 » Linux application packaging and universal formats
- 23 Dec 2020 » Detecting polymorphisms in the RD900 region of MTBC species
- 19 Dec 2020 » Tablexplore - a desktop tool for table analysis
- 29 Nov 2020 » Epidemics, PCR and the dangers of mass testing
- 28 Nov 2020 » Convert a multi-sample VCF to a pandas DataFrame
- 15 Nov 2020 » A network agent based infection model with Mesa
- 10 Nov 2020 » Find PFAM domains in protein sequences with Python
- 02 Nov 2020 » Covid-19 and T cell immunity
- 28 Oct 2020 » Estimating Irelands tree coverage with QGIS and GeoPandas
- 18 Oct 2020 » Build an exe using pyinstaller with GitHub Actions
- 06 Oct 2020 » A simple image gallery in Jekyll without plugins
- 05 Sep 2020 » An MHC-Class I binding predictor with sklearn, part 2
- 18 Aug 2020 » Ireland COVID-19 trend in positive rate
- 15 Aug 2020 » Predicting cross-reactive T cell epitopes in Sars-CoV-2
- 06 Aug 2020 » COVID tracking project - tests vs positive rates
- 24 Jul 2020 » Death causes in England and Wales comparison - Winton Centre
- 21 Jul 2020 » Sequence alignment viewer with Qt/PySide2
- 11 Jul 2020 » Eurostat deaths from all causes dataset plots
- 07 Jul 2020 » pathogenie - A desktop application for microbial genome annotation
- 19 May 2020 » Fasta alignment from a multi sample VCF - a less terrible method
- 12 May 2020 » SNiPgenie - a tool for SNP site detection from NGS data
- 28 Apr 2020 » Simple MTBC regions of difference analysis with Python
- 19 Apr 2020 » Finding all amino acid mutations in SARS-CoV-2
- 14 Apr 2020 » A simple agent based infection model with Mesa and Bokeh
- 07 Apr 2020 » Create a fasta alignment from a multi sample VCF
- 01 Apr 2020 » COVID-19 ECDC data dashboard with Panel
- 28 Mar 2020 » COVID-19 ECDC data plots with Bokeh
- 18 Mar 2020 » Run bcftools mpileup in parallel with Python
- 11 Mar 2020 » Deploy a Python application with snapcraft
- 02 Mar 2020 » Model of the SARS-CoV-2 spike protein in Blender
- 28 Feb 2020 » Explore the SARS-CoV-2 spike protein sequences using Python tools
- 18 Feb 2020 » Updates to a genome annotation on the ENA via Webin-CLI
- 05 Feb 2020 » Plot fastq file metrics with Python
- 30 Jan 2020 » Compile windows exe files with MSYS2
- 25 Jan 2020 » A simple genome browser with Qt and dna_features_viewer
- 06 Jan 2020 » Interactive plots of World development indicators with Panel
- 03 Jan 2020 » Concurrent processes in PySide2/PyQt5 applications
- 14 Dec 2019 » Genome annotation with BLAST, Prodigal and Biopython
- 29 Nov 2019 » Embed Bokeh plots in Jekyll markdown
- 28 Nov 2019 » Categorical region plots with geopandas
- 15 Nov 2019 » Choropleth maps with geopandas, Bokeh and Panel
- 05 Nov 2019 » Analysis of MTBC regions of difference with NucDiff
- 20 Oct 2019 » Rapid Average Nucleotide Identity calculation with FastANI
- 13 Oct 2019 » NucDiff for bacterial whole genome comparisons
- 30 Sep 2019 » Plotting global sea ice extent data with four different Python packages
- 24 Sep 2019 » Interactively view datasets with HoloViews
- 15 Sep 2019 » Javascript callbacks for linking bokeh plots to panel widgets
- 31 Aug 2019 » Retrieving genome assemblies via Entrez with Python
- 12 Aug 2019 » Accessing data from the PDB with Python
- 22 Jul 2019 » Bioinformatics on the Raspberry Pi 4
- 11 Jul 2019 » A sequence alignment viewer with Bokeh and Panel
- 02 Jul 2019 » Dashboards with PyViz Panel for interactive web apps
- 17 May 2019 » Predicting neoantigens
- 04 Apr 2019 » Make protein models with Blender
- 20 Mar 2019 » Sequence, gene and protein databases: are you confused?
- 27 Feb 2019 » Unknown proteins in Mycobacterium tuberculosis
- 25 Feb 2019 » Reading and writing genbank/embl files with Python
- 25 Nov 2018 » Using epitopepredict for MHC binding prediction in Python
- 12 Nov 2018 » Create an MHC-Class I binding predictor in Python
- 09 Oct 2018 » Creating a local RefSeq protein blast database
- 14 Aug 2018 » Create a bacterial GFF from a genbank file for BCFtools/csq
- 05 Jul 2017 » DataExplore - grouped plots in version 0.8.0
- 11 Dec 2015 » Example: plotting miRNA abundance data (advanced)
- 15 Sep 2015 » Looking at the Titanic dataset
- 18 Jul 2015 » Zenodo and sharing your software
- 14 Jun 2015 » Educational software for data analysis
- 11 Jun 2015 » DataExplore Features
- 30 May 2015 » DataExplore Introduction