Estimating Irelands tree coverage with QGIS and GeoPandas
Background
Today, only around 11% of the land area of Ireland is covered in trees, compared to the EU average of over 30%. Much of this is non-native species in the form of sitka spruce plantations. It’s a useful exercise to map these forested areas using freely available data. Note that to use the official datasets provided by the Irish Department of Agriculture, Food and the Marine (DAFM), you need to apply for access. Here we use QGIS, a free desktop tool for handling geospatial information.
Getting the data
Irelands tree coverage can be reasonably well estimated by using OpenStreetMap (OSM) data only. This does depend on the reliability of the features. It will work for any country for which there are such features marked out. This was done as follows:
- Open QGIS and make a new project. Add the OpenStreetMap layer from XYZ tiles. Now you can navigate to the area covering the country or region you want to get the data for.
- Open Vector->QuickOSM. We then need to retrieve all features matching the
landuse:forestryornatural:woodkey:value pairs. You simply enter these values in to both boxes, choose canvas extent underneath and click ‘run query’. The results will be loaded as a new vector layer. These will be polygons outlining the forestry areas. I ran both queries separately. - From these we can calculate the approximate area covered by trees in each county. To do this we must first add county information to the features. I did this by using an Irish counties shapefile found here and also loaded it into QGIS. Then I used the tool under Vector->Data Management Tools->Join Attributes by Location. This lets us merge two sets of features by their physical overlap. I used join type one-to-one (not one-to-many). The result is a new layer with the county added to each row. We can delete the older layer.
- Save the layers as shapefiles so we can use below in Python. If you look at the attributes of the layers there are a lot of empty columns. These can be deleted if you wish. This will reduce the file size a lot if you want to save the layer as a shapefile.
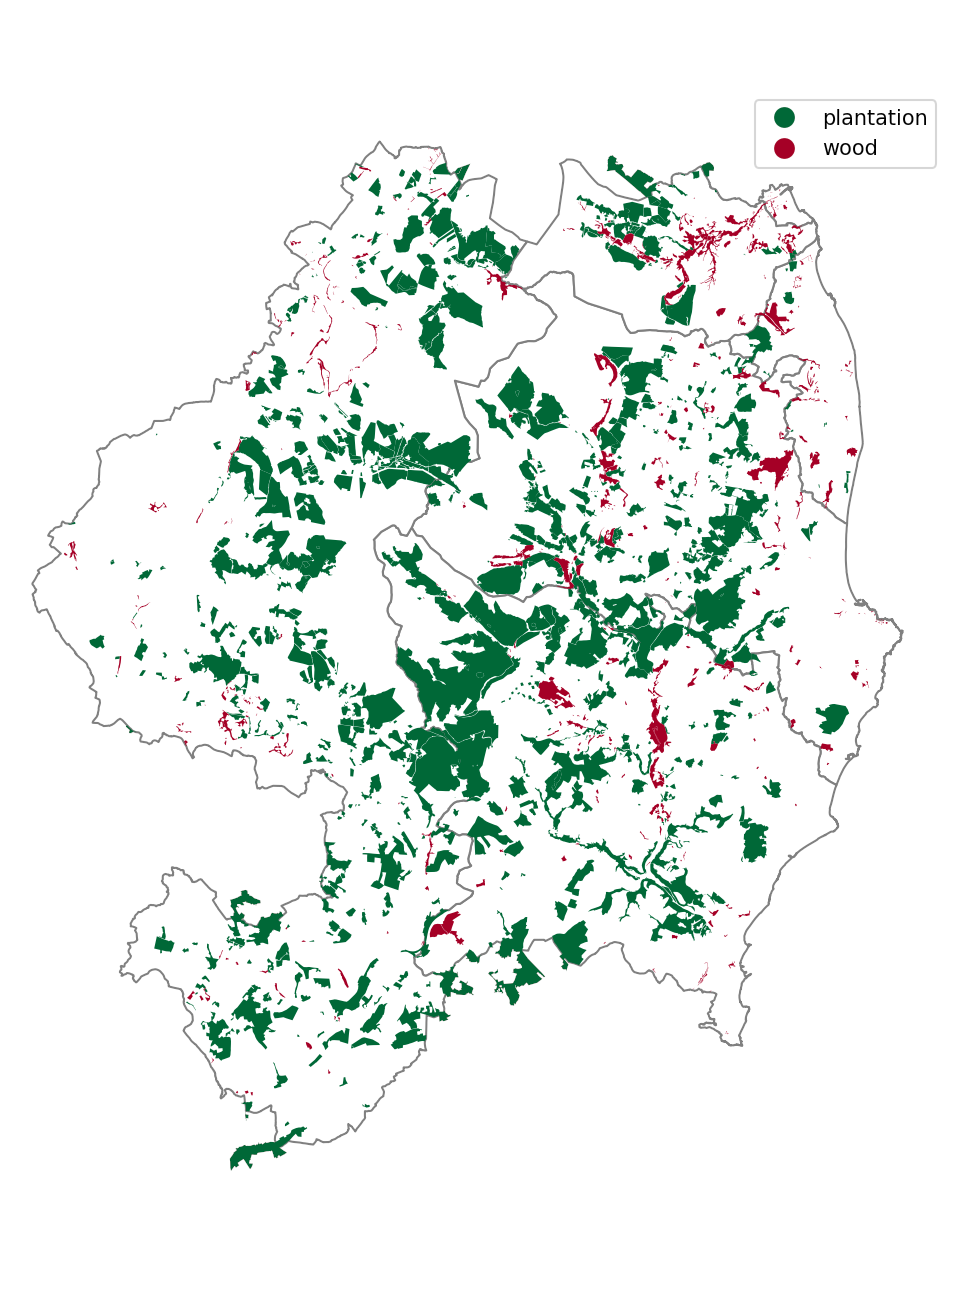
The map will now look like the one below, zoomed in on the South Dublin region:
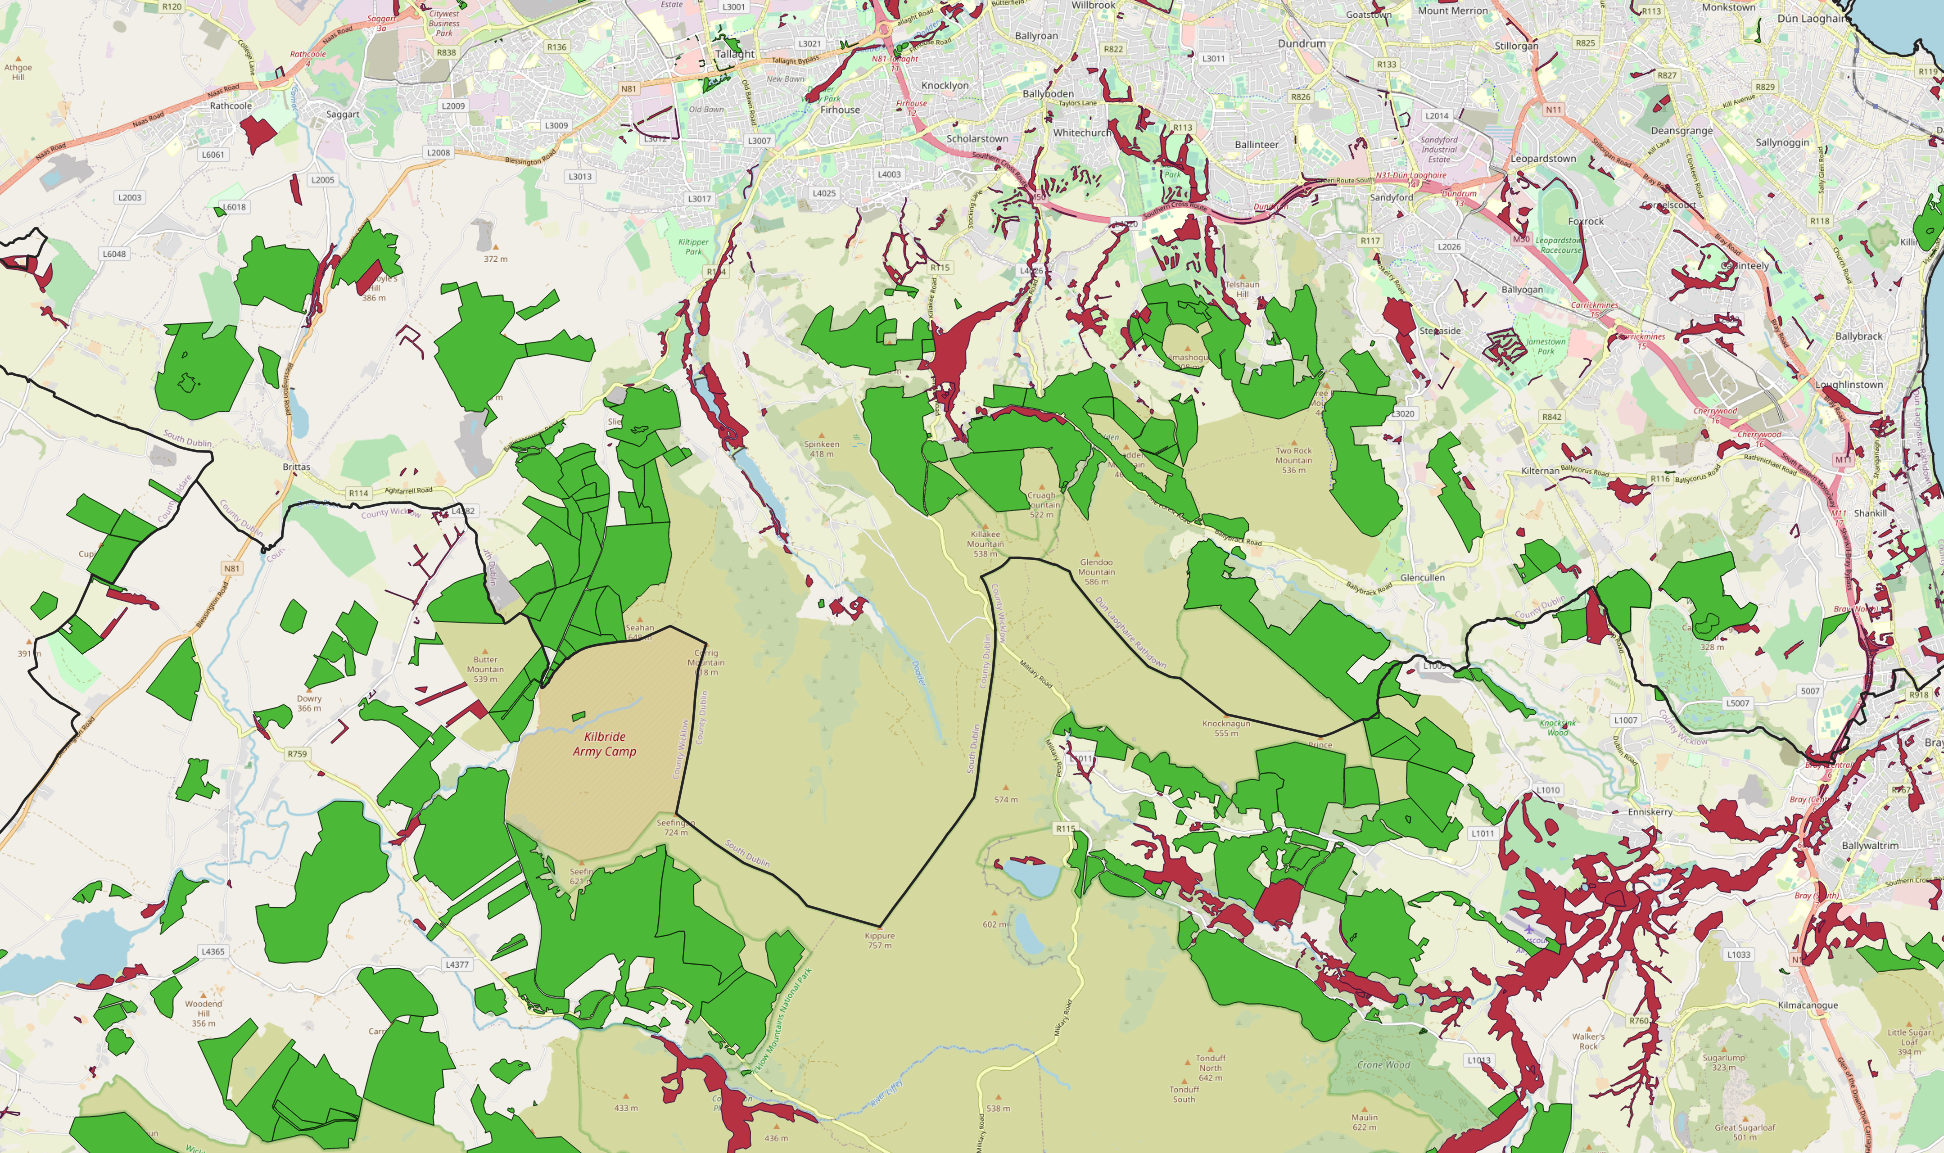
Map of Wicklow and South Dublin forested areas. Green are largely forestry plantations, mostly coniferous. Red are public and private mixed woodland.
Calculate coverage
To calculate the areas I used GeoPandas. We load the shapefiles into a GeoDataFrame and then use the geometry.area function to calculate per polygon. Note that the layer is first converted to use an ‘equal-area’ projection (EPSG:6933) so that the area can be found accurately. We then just sum the areas over each county. The result will be in km2. This dataframe is merged with the counties one to get the tree coverage as a percentage of the total area. The code is below:
#read in counties
counties = gpd.read_file('data/counties.shp')
counties=counties.to_crs("EPSG:3857")
counties['total_area'] = counties['geometry'].to_crs('EPSG:6933').geometry.area/10**6
#get layers we saved in QGIS
forests = gpd.read_file('forestry_data/landuse_forests.shp')
forests = forests.to_crs("EPSG:3857")
forests['type'] = 'plantation'
woods = gpd.read_file('forestry_data/natural_wood.shp')
woods = woods.to_crs("EPSG:3857")
woods['type'] = 'wood'

forests['area'] = forests.to_crs('EPSG:6933').geometry.area/10**6
woods['area'] = woods.to_crs('EPSG:6933').geometry.area/10**6

#put all in one table
A = pd.concat([forests,woods])
#find coverage
coverage = A.groupby('county').agg({'area':sum}).reset_index().rename(columns={'area':'coverage'})
counties = counties.merge(coverage,left_on='NAME_TAG',right_on='county')
counties['perc_coverage'] = counties.coverage/counties.total_area
This gives a table as below, showing Wicklow as the county with highest percentage coverage.
| county | total_area | coverage | perc_coverage |
|---|---|---|---|
| Wicklow | 2023.697079 | 400.982034 | 0.1981 |
| Laois | 1719.354771 | 238.214524 | 0.1385 |
| Sligo | 1836.173627 | 241.084372 | 0.1312 |
| Leitrim | 1588.482064 | 204.471872 | 0.1288 |
| Waterford | 1861.843861 | 223.723845 | 0.1201 |
| Fermanagh | 1850.831695 | 199.480626 | 0.1078 |
Forestry cover plot
We can now plot the coverage maps from our GeoDataFrames:
fig, axs = plt.subplots(1,2, figsize=(20,12))
axs=axs.flat
x = forests.sample(5000)
counties.plot(edgecolor='0.5',linewidth=0.5,color='white',ax=axs[0])
forests.plot(edgecolor='0.2',linewidth=.5,alpha=0.7,color='brown',ax=axs[0])
woods.plot(edgecolor='0.2',linewidth=.5,alpha=0.7,color='green',ax=axs[0])
counties.plot(column='coverage',edgecolor='0.2',linewidth=.5,cmap='Greens',
              legend=True,legend_kwds={'label': "Tree coverage (square km)", "shrink": .6}, ax=axs[1])

counties['coords'] = counties['geometry'].apply(lambda x: x.representative_point().coords[:][0])
for idx, row in counties.iterrows():
    plt.annotate(text=row['NAME_TAG'], xy=row['coords'],
                 horizontalalignment='center', fontsize=8)
plt.tight_layout()
axs[0].set_axis_off()
axs[1].set_axis_off()
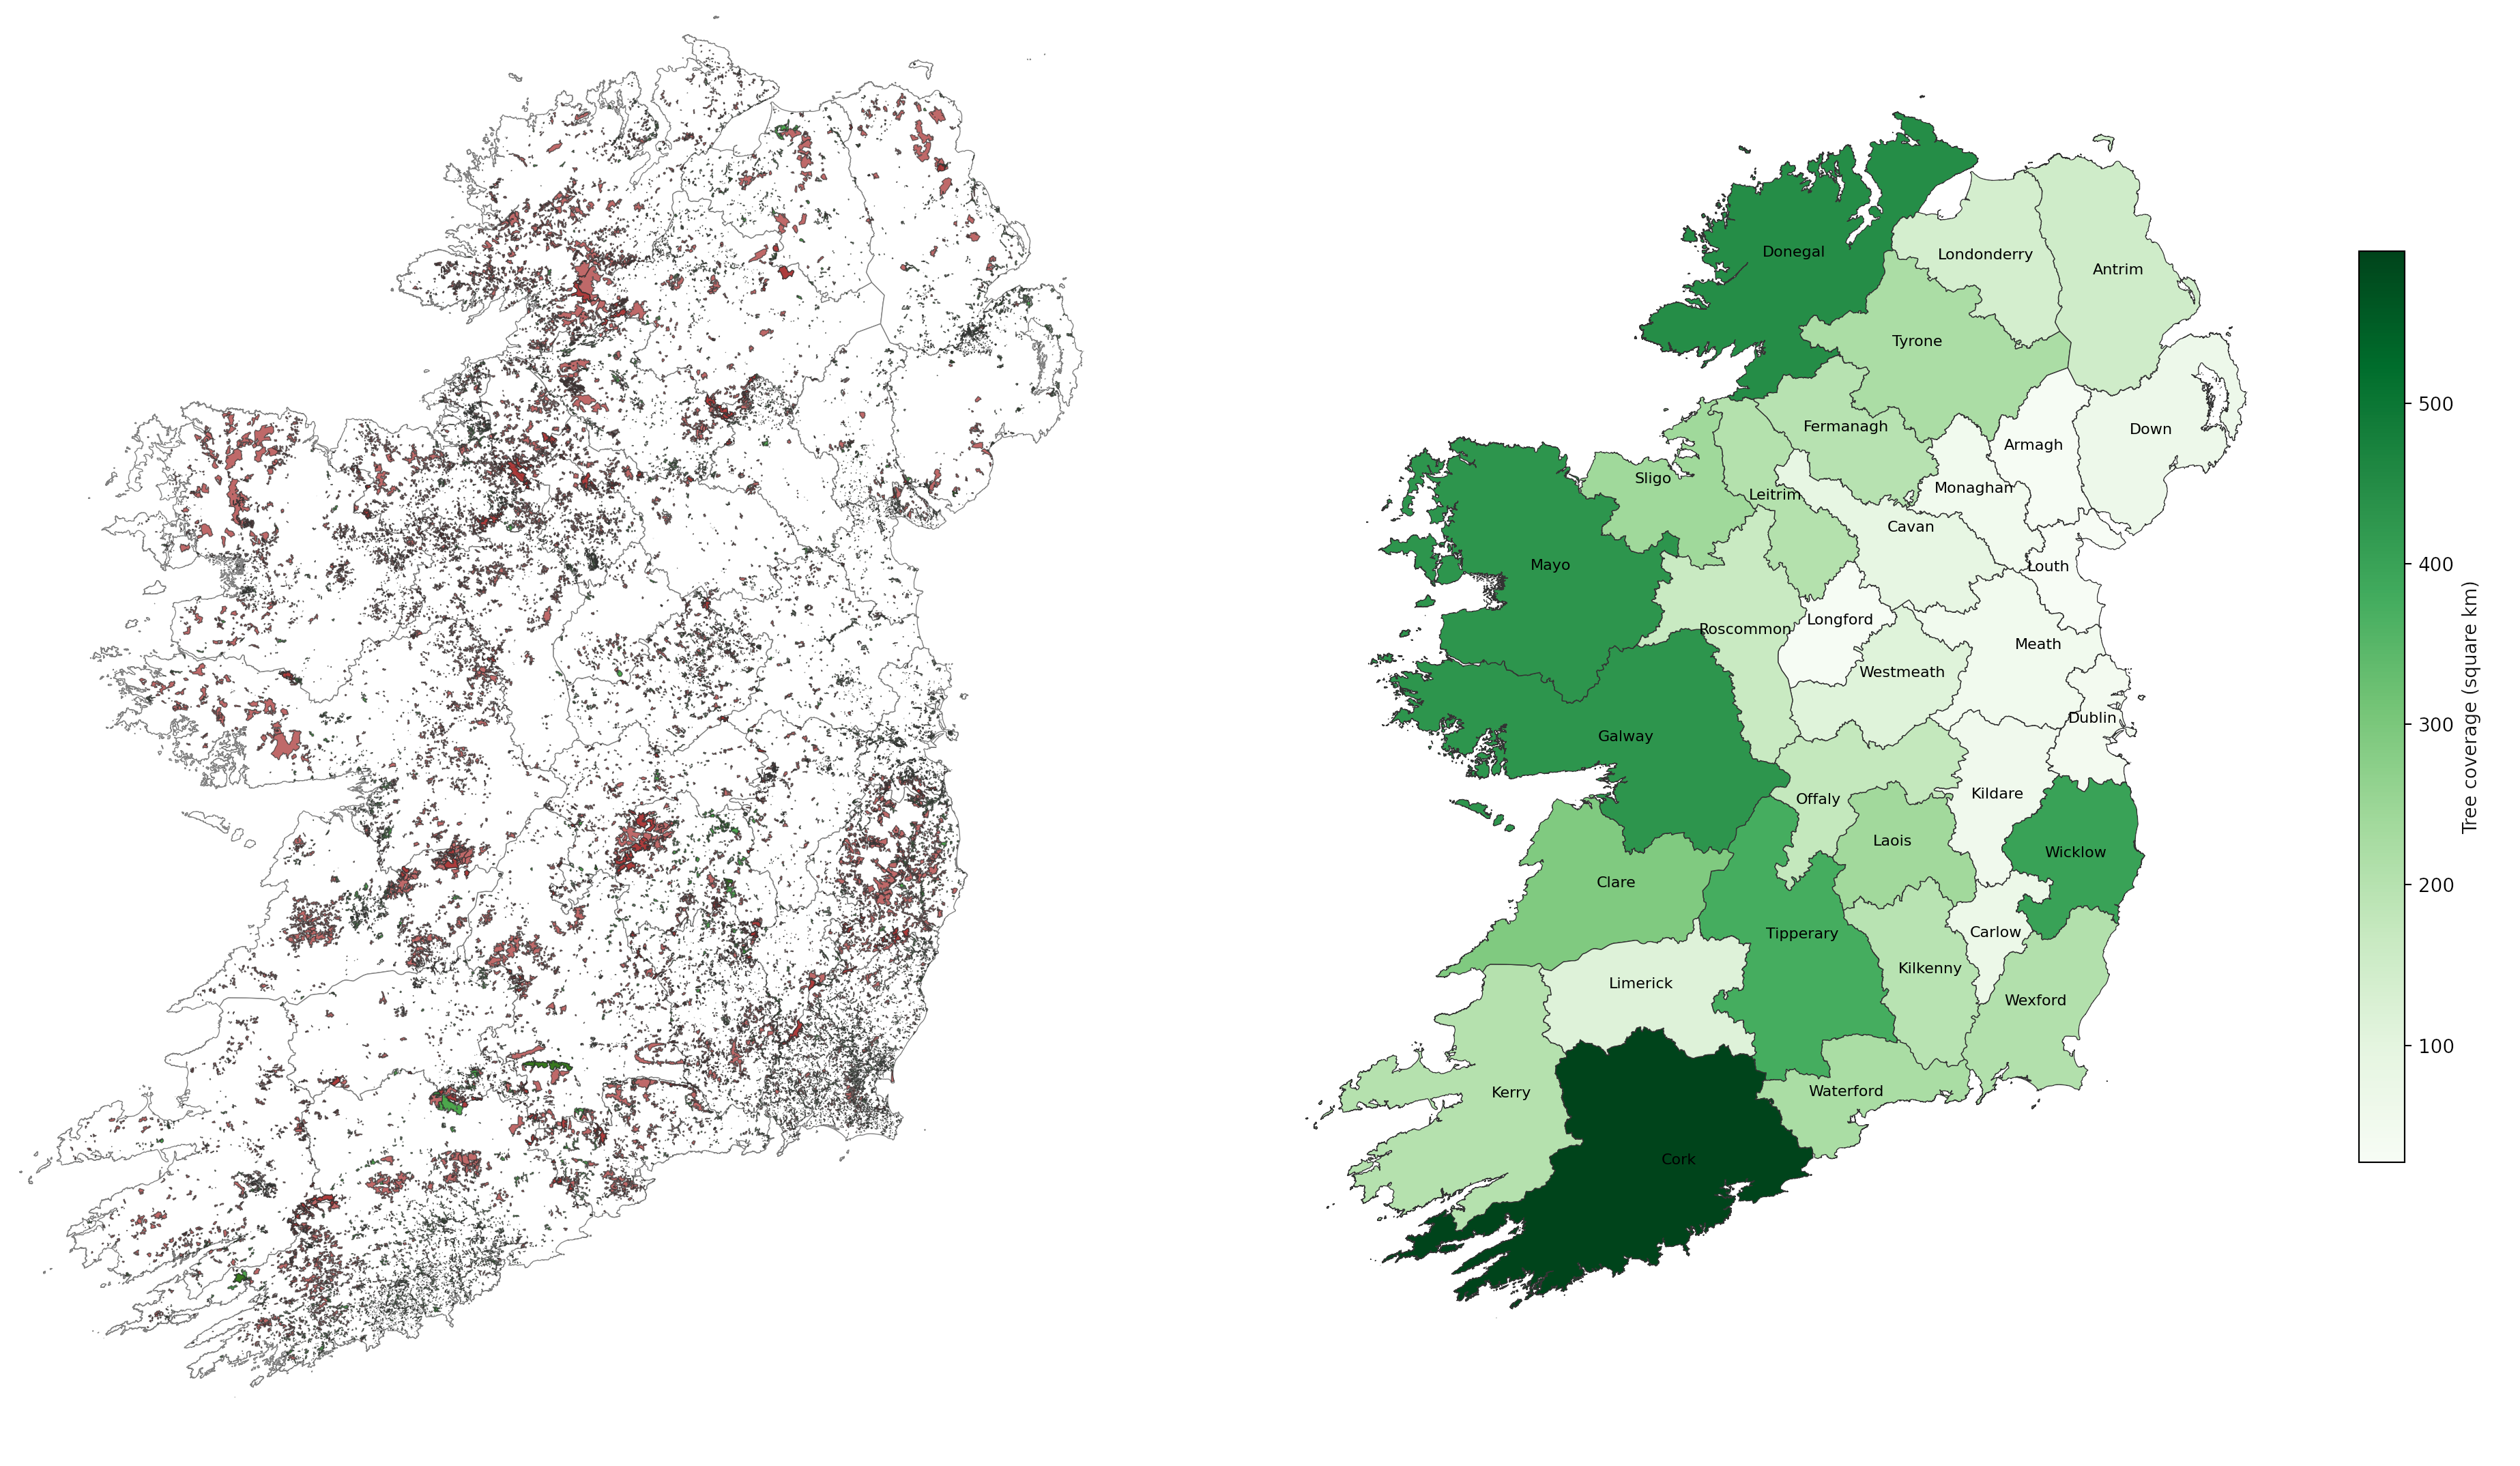
Tree coverage in Ireland. Total in square km per county is on left, darker is higher.
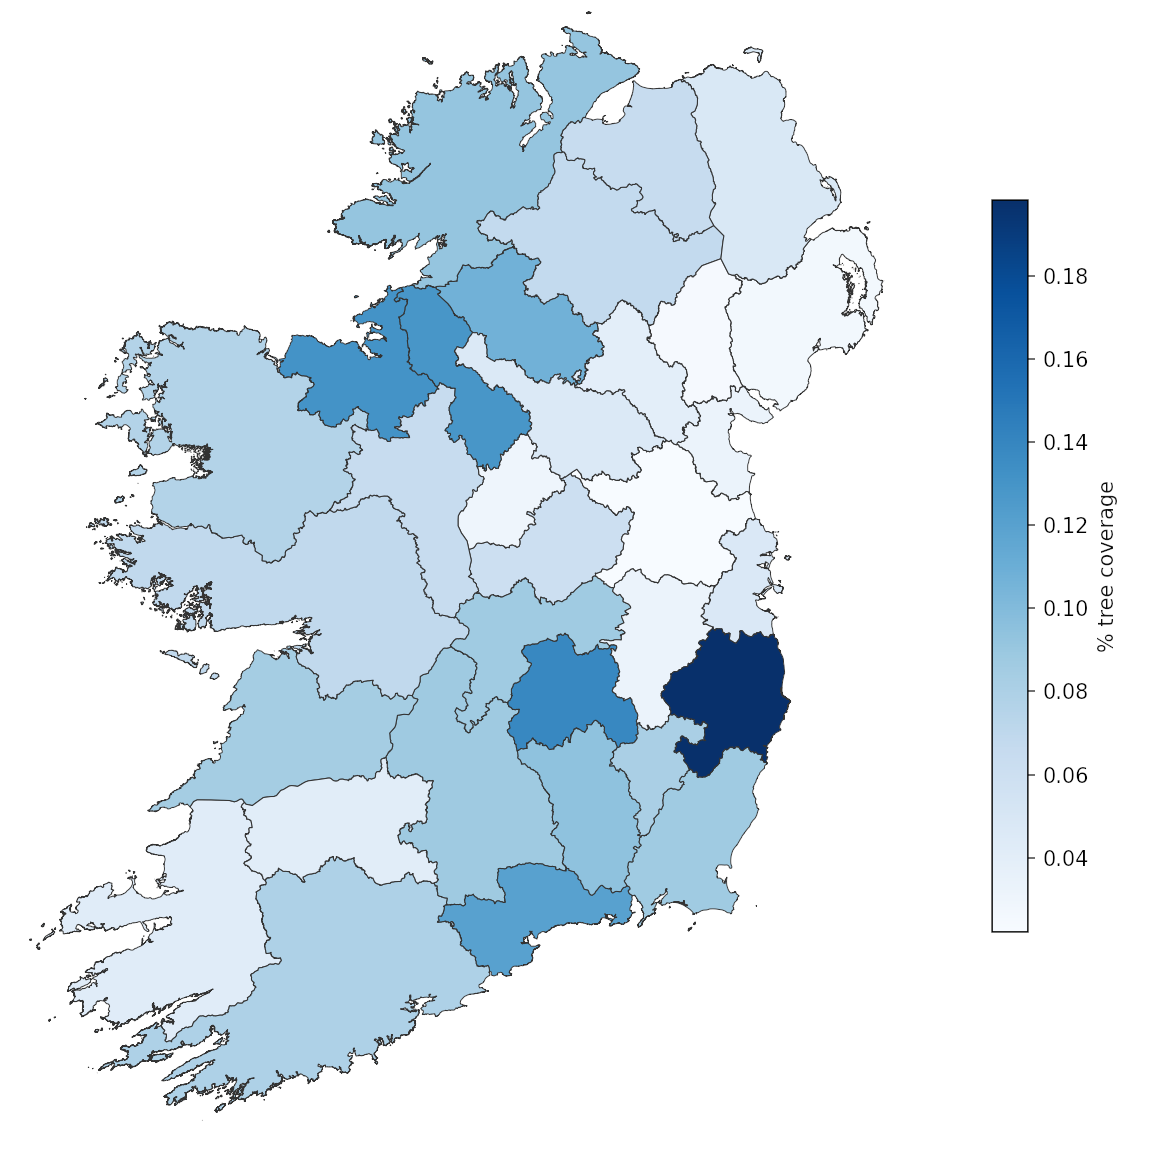
Percentage tree cover shows a different view. Wicklow has the largest portion of its area covered by mostly coniferous plantations.
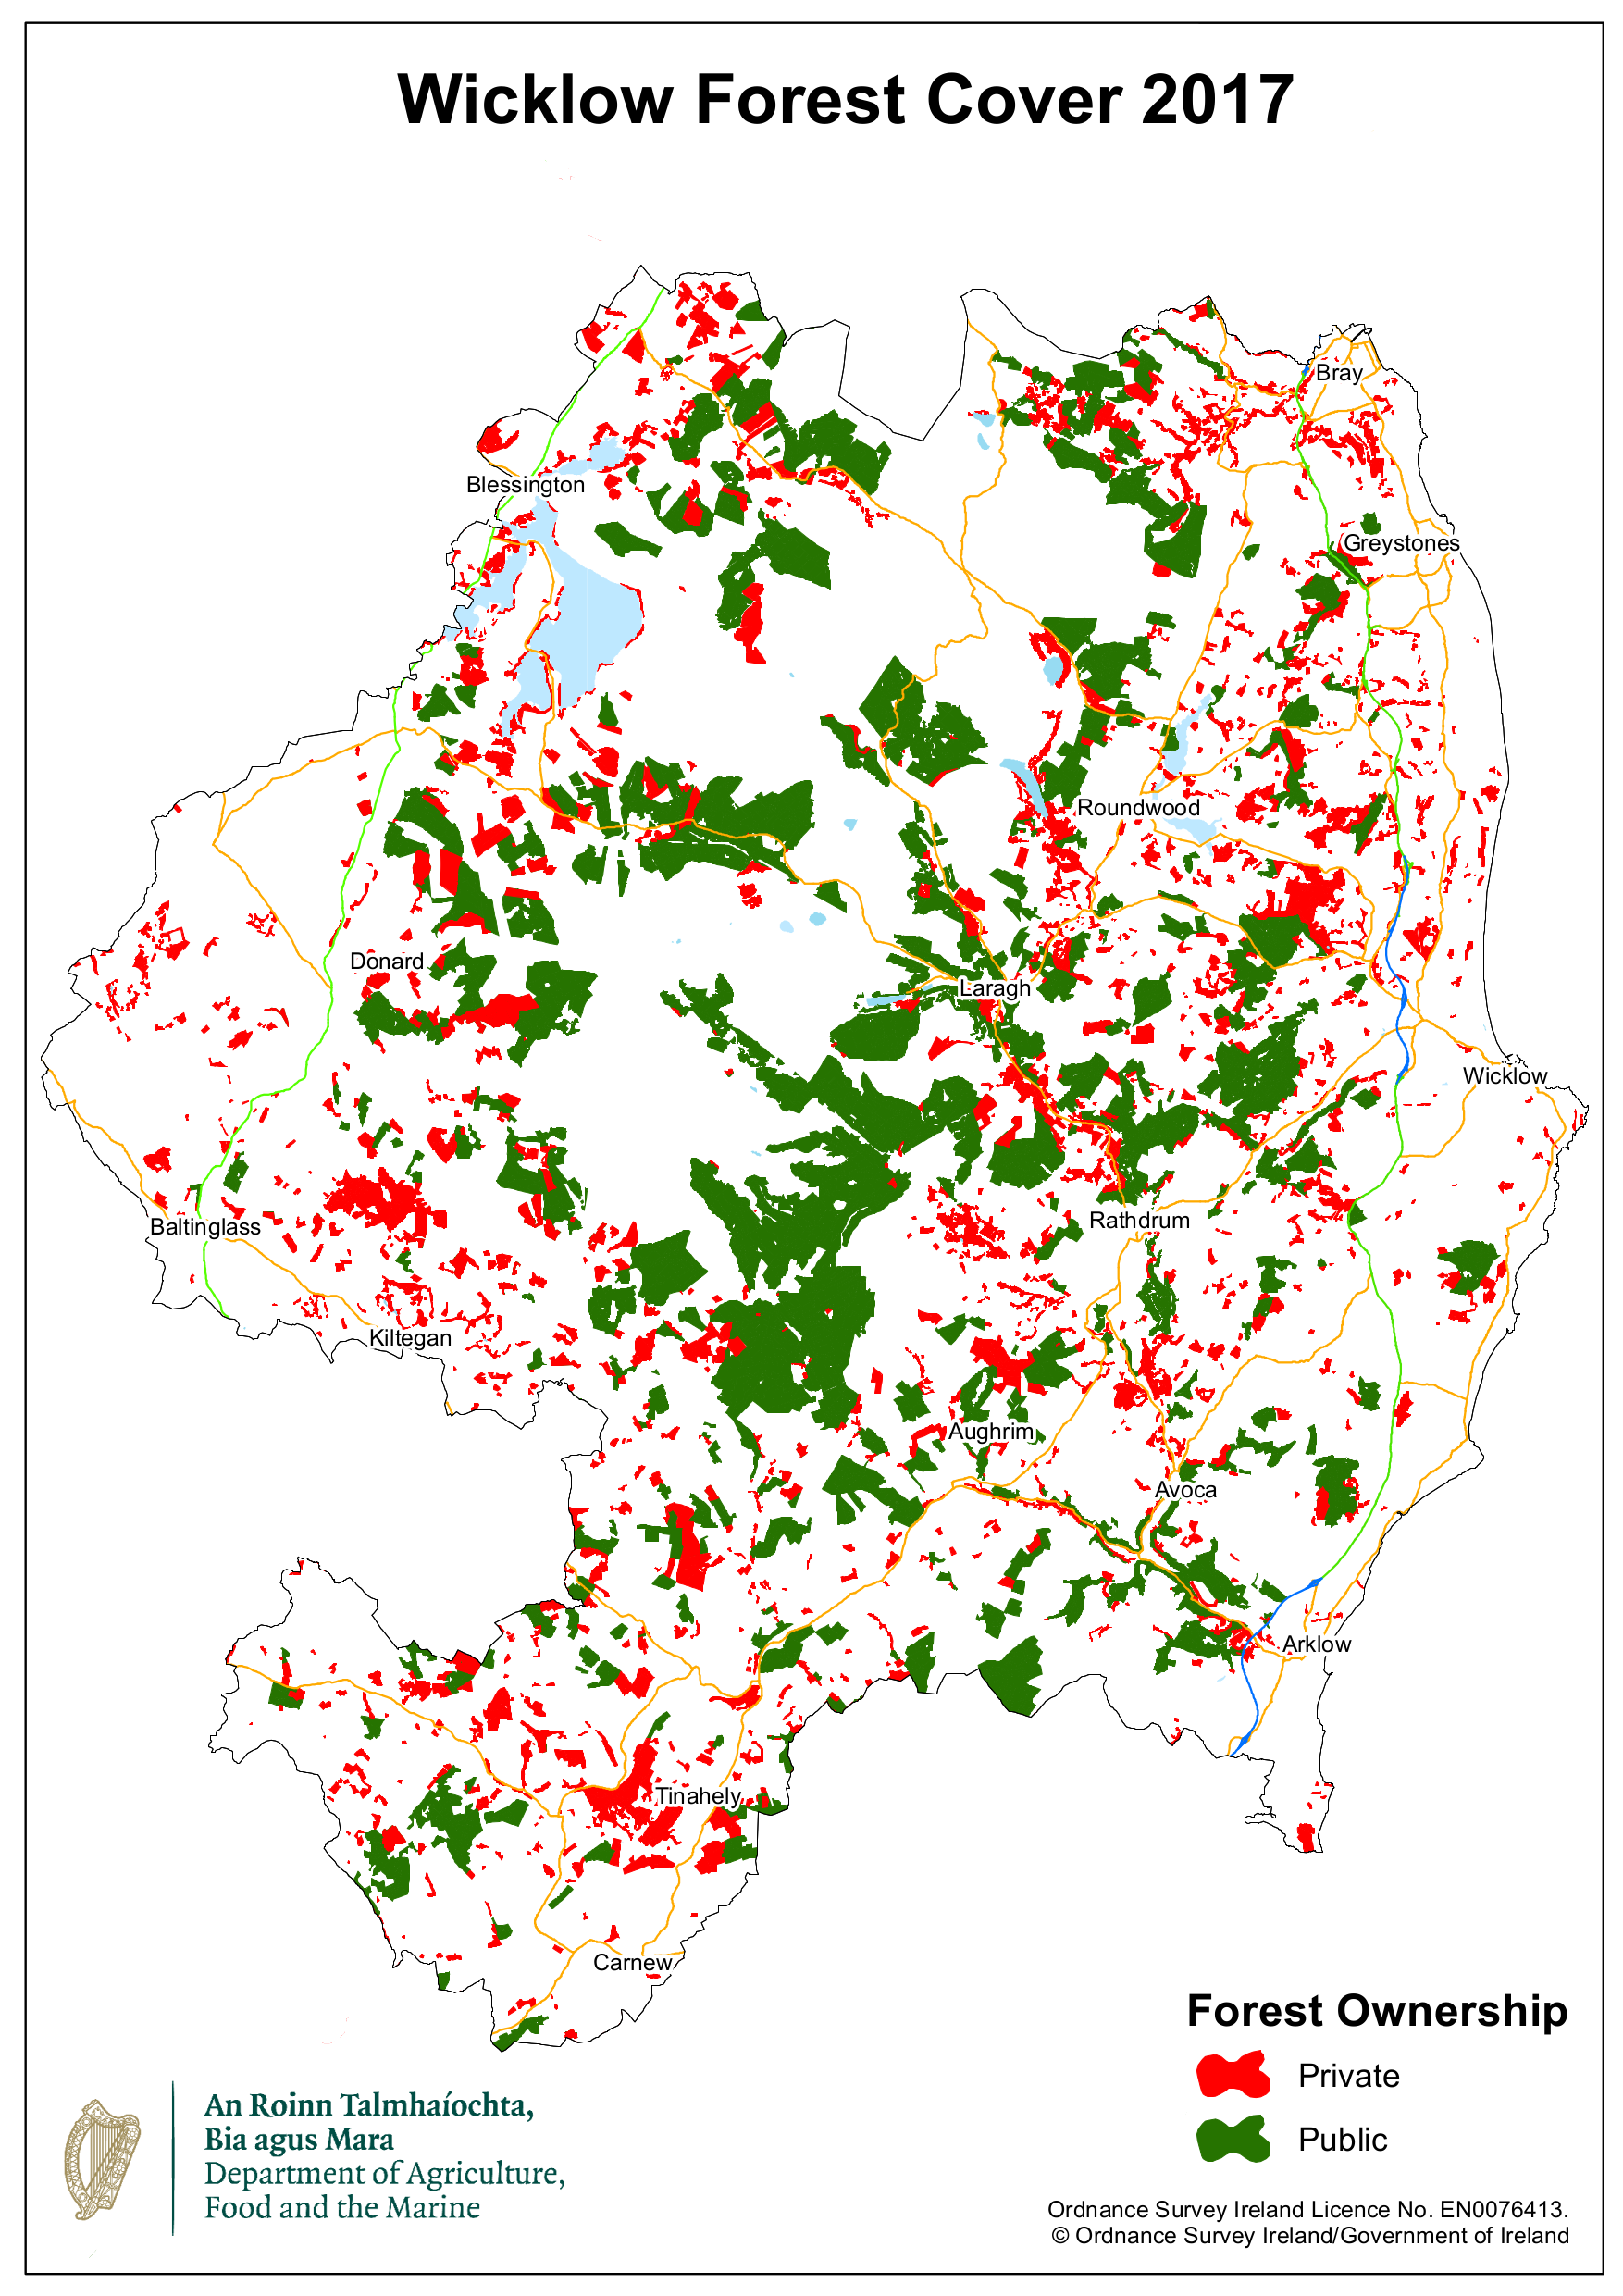
Comparison to DAFM maps
We can check how our maps look compared to the official ones provided by DAFM. Official maps provided by DAFM are available here. We can see below that they are broadly the same though with some differences. Certain areas are not marked as forests/woods on OSM and are missing in our map. For example Rathsallagh demesne near Donard is not demarcated on OSM, possibly because it’s also a golf course.
The Jupyter notebook used to make the plots is available here.