The scale of US bombing in Southeast Asia revealed in the THOR dataset
Background
The staggering scale of US bombing during and since the second world war is no secret, most particularly in Southeast Asia. Though the war was centred on Vietnam, the whole region was subject to intense bombardment by a multitude of kinds of weapons. Defoliants such as agent orange were widely used, mostly in South Vietnam. The land was also showered with huge numbers of anti-personnel mines (cluster munitions). This was all made clear in greater detail with the release of the THOR dataset in 2013. THOR stands for Theater History of Operations Reports, a huge database published by the U.S. Defense Digital Service of all unclassified U.S. air operations, including WWI, WWII, and the Korean and Vietnam wars. With each mission is stored date, location of target, weapon type and multiple other features. The file for just the Vietnam era data is 1.5 GB and can be found at data.world. Here we show some fairly simple plots using pandas, matplotlib and geopandas. The code can be revealed from the collapsible sections if you want to see it.
The data
First the data was loaded into a DataFrame and pre-processed to create a smaller version which could more easily be used in-memory. Just by selecting out a subset of columns and removing rows that had no co-ordinates. So the data looks like this:
| MSNDATE | TGTCOUNTRY | TAKEOFFLOCATION | WEAPONTYPE | MFUNC_DESC | TGTLATDD_DDD_WGS84 | TGTLONDDD_DDD_WGS84 | YEAR |
|---|---|---|---|---|---|---|---|
| 1965-10-01 | SOUTH VIETNAM | DANANG | 250LB MK-81 | ESCORT/COVER | 15.411990 | 108.593668 | 1965 |
| 1965-10-01 | SOUTH VIETNAM | MIDWAY (CVA-41) | NaN | AIR INTERDICTION | 13.094236 | 108.778555 | 1965 |
| 1965-10-01 | SOUTH VIETNAM | MIDWAY (CVA-41) | 1000LB MK-83 | AIR INTERDICTION | 11.081992 | 107.506363 | 1965 |
Total missions with coordinates:
| Country | Missions |
|---|---|
| THAILAND | 2427 |
| CAMBODIA | 144944 |
| NORTH VIETNAM | 581897 |
| LAOS | 1041519 |
| SOUTH VIETNAM | 1620422 |
Summary plots
Missions are categorised by their function, such as ‘strike’ or ‘armed reece’. Not all involved use of weapons as some are photographic missions. The breakdown by country can be seen below. Note that two thirds of ‘strike’ missions are in Laos, not Vietnam.
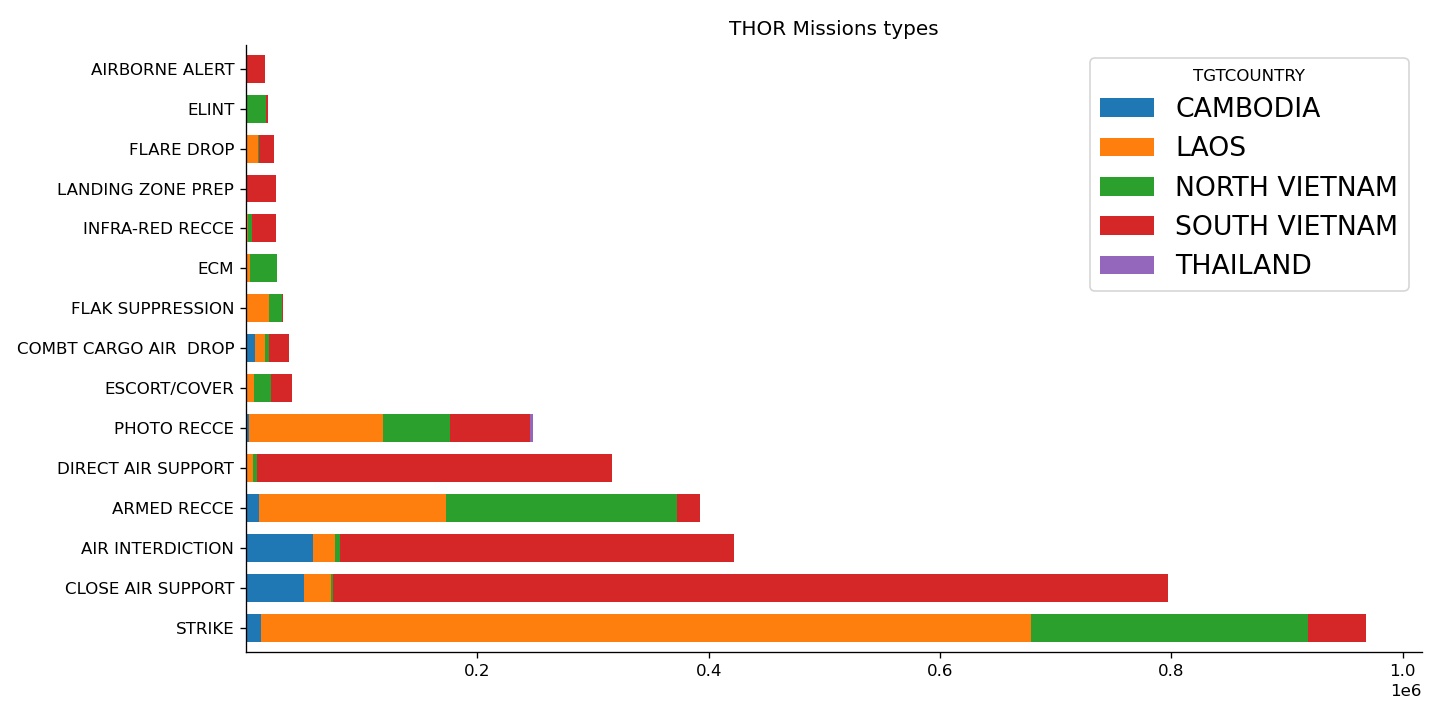
15 most common mission types flown. Combat operations are the majority.
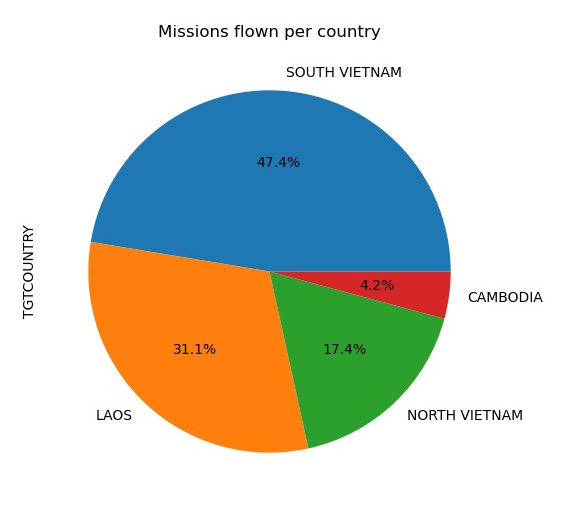
Totals of all missions flown (that have coordinates) by country.
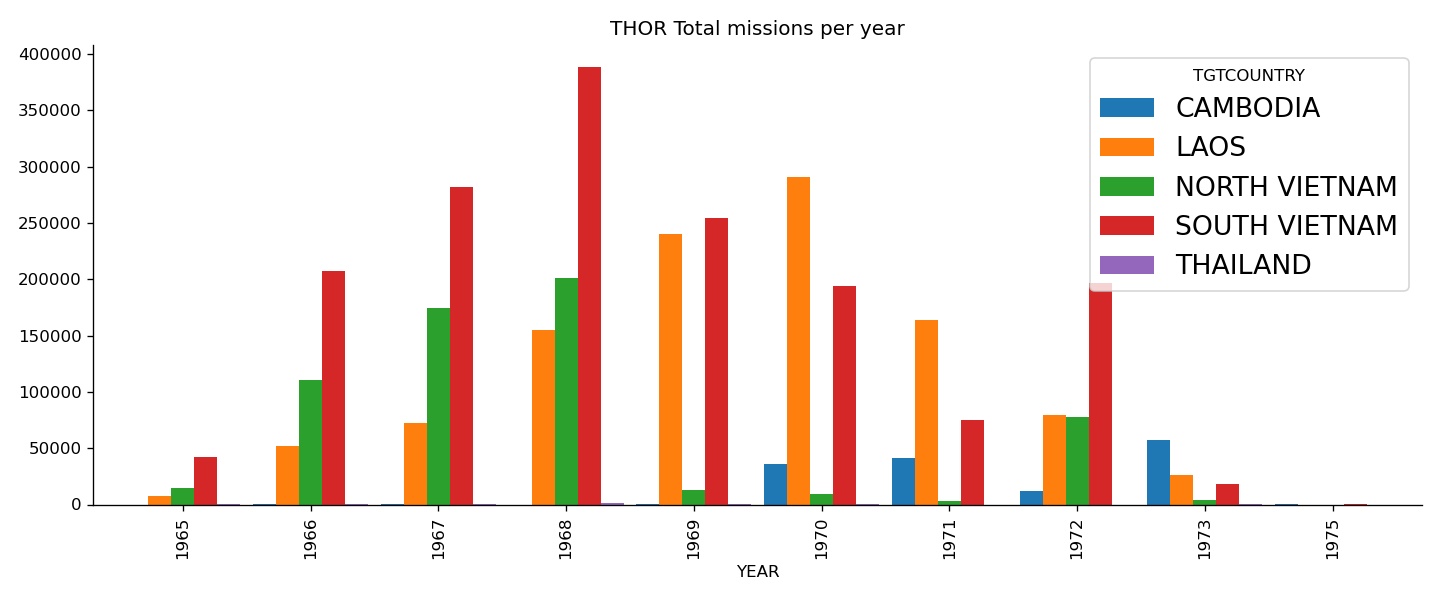
Missions per year per country.
Below is a time series per country, derived by taking a rolling 28 day average to smooth the data. The y-axis to number of missions (in this case a rolling average).

Time course of missions per country.
import pandas as pd
import pylab as plt
import seaborn as sns
from collections import OrderedDict
import datetime as dt
import geopandas as gpd

#get a smaller file with subset of columns
cols = ['MSNDATE','TGTCOUNTRY','TAKEOFFLOCATION','WEAPONTYPE',
     'MFUNC_DESC','TGTLATDD_DDD_WGS84','TGTLONDDD_DDD_WGS84']
s=df[cols]
s=s.sort_values('MSNDATE')
s.to_csv('thor_data_vietnam_small.csv')

s['MSNDATE'] = pd.to_datetime(s.MSNDATE, format='%Y/%m/%d',errors='coerce')
s['YEAR'] = s.MSNDATE.dt.year.fillna(0).astype(int)
s=s[s.YEAR>0]
#only get those rows with a coordinate
x = s[~s.TGTLATDD_DDD_WGS84.isnull()].copy()

#Missions flown per country
c = x.TGTCOUNTRY.value_counts()
c.plot(kind='pie',figsize=(6,6))
print(c)
plt.title('Missions flown per country')
plt.savefig('thor_seasia_summary_totals.jpg',dpi=100)

#total missions per year
y=pd.pivot_table(x,index='YEAR',columns=['TGTCOUNTRY'],values='x',aggfunc='size')
y.plot(kind='bar',width=.9,figsize=(12,5))
plt.title('Total missions per year')
plt.savefig('thor_seasia_summary_byyear.jpg',dpi=100)

#time series
ts=pd.pivot_table(x,index='MSNDATE',columns=['TGTCOUNTRY'],values='x',aggfunc='size').iloc[:,:4]
ts=ts.rolling(window=28).mean()
plt.rc('legend',fontsize=16)
ax=ts.plot(lw=3,subplots=True,figsize=(18,10))
plt.tight_layout()
plt.savefig('thor_seasia_time_series.jpg',dpi=120)
The bombing of Laos
Laos is the most bombed country in history, certainly in proportion to it’s population. From 1963 to 1974 the U.S. dropped about 4 billion bombs on Laos. This was carried out largely to disrupt North Vietnamese supply routes across the Ho Chi Minh Trail to the south. But it was also part of the ‘secret war’ against the Pathet Lao, the leftist movement that controlled much of the countryside. The level of terror levelled against the rural population over years of bombing is hard to imagine. Often the villagers did not know who was bombing them or why. The war in Laos was entirely illegal since the country was neutral and had been independent since 1954.
An enormous bomb crater in Xiang Khouang province, Laos.

Lao villagers in the plain of Jars standing over a shot down US bomber during the secret bombing campaign.
Missions per year
This plot shows the locations of all missions flown to targets in Laos each year.
Bombing missions per year.
#get shapefile
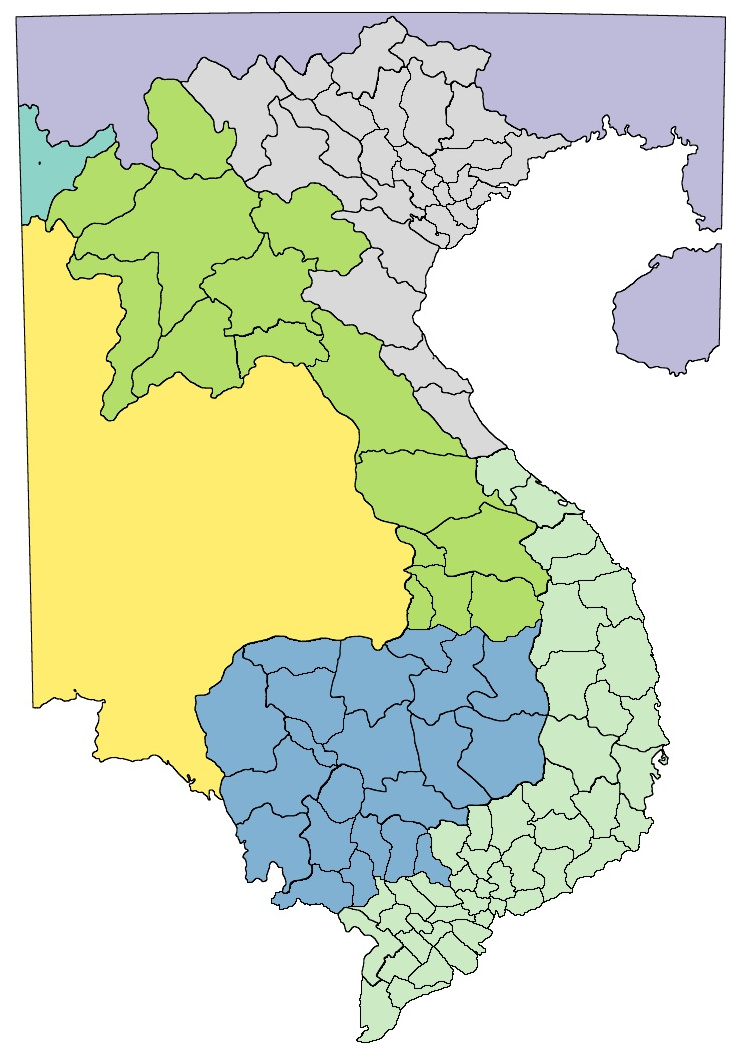
borders = gpd.read_file('SE_ASIA_PROVINCES_SV_NV_KH_LA.shp')
borders.plot(column='COUNTRY',cmap='Set3',lw=.5,ec='black',figsize=(10,10))
plt.savefig('seasia_map.jpg',dpi=150)
#get only laos rows
laos = x[x.TGTCOUNTRY=='LAOS']
gdf = gpd.GeoDataFrame(laos, geometry=gpd.points_from_xy(laos.TGTLONDDD_DDD_WGS84,
laos.TGTLATDD_DDD_WGS84),crs="EPSG:4326")
#plot each year
f,ax = plt.subplots(3,3,figsize=(18,12))
axs = list(ax.flat)
i=0
for y,g in gdf.groupby('YEAR'):
ax=axs[i]
borders.plot(column='COUNTRY',cmap='Set2',lw=.2,ec='gray',ax=ax)
g.plot(color='red',markersize=1,alpha=.5,ax=ax)
ax.set_xlim(100,110)
ax.set_ylim(13,23)
ax.set_title(y)
i+=1
f.suptitle('Bombing of Laos by year',fontsize=20)
plt.tight_layout()
plt.savefig('thor_laos_map_byyear.jpg',dpi=150)
Animation
We can also animate the data to get an idea of patterns over time. I did this by grouping the dataframe by month and then updating a Panel matplotlib pane. I then recorded the changes to a gif. This is not really the recommended matplotlib way to animate plots!

Bombing missions per month targeted to Laos.
laosmap=borders[borders.COUNTRY=='LA']
f = plt.figure(figsize=(9,8))
f.suptitle('LAOS BOMBING (THOR data)', fontsize=20)
mpl_pane.object = f
import time
time.sleep(5)
for date,g in gdf.groupby(['YEAR','MONTH'],sort=True):
    plt.clf()
    f.suptitle('LAOS BOMBING (THOR data)', fontsize=20)
    ax=f.add_subplot(label=date)
    laosmap.plot(column='COUNTRY',cmap='Set2',lw=1,ec='black',ax=ax)
    g.plot(color='red',markersize=10,alpha=.4,ax=ax)
    ax.set_xlim(100,108)
    ax.set_ylim(14,23)
    #ax.set_title(date.strftime("%b %d %Y"), fontsize=20)
    ax.set_title(str(date[0])+' '+str(date[1]), fontsize=20)
    ax.axis('off')
    mpl_pane.object=f
    mpl_pane.param.trigger('object')

plt.clf();
#we can then update this pane
mpl_pane = pn.pane.Matplotlib(height=600)
mpl_pane
Cluster munitions
Cluster munitions are anti-personnel weapons heavily used in Laos. It is thought that of the 260 million cluster bomblets that were dropped on Laos between 1964 and 1973, 80 million failed to explode (the Guardian). This has left a terrible problem of unexploded ordinance in the countryside that continues till the present. We can plot the subset of data corresponding to some of the cluster bomb types like the CBU-24. This shows the concentrations along the section of the Ho Chi Minh trail and in Xieng Khouang province in the North.
Locations of three cluster bomb types in Laos over all years.
cluster_types=['CBU-24/29','CBU-14/25','CBU-2']
f,ax=plt.subplots(1,3,figsize=(18,12))
clrs=['blue','brown','red']
axs=list(ax.flat)
i=0
for c in cluster_types:
    ax=axs[i]
    cl = gdf[gdf.WEAPONTYPE==c]
    laosmap.plot(color='lightgray',lw=.5,ec='black',ax=ax)
    cl.plot(color=clrs[i],markersize=10,alpha=.3,ax=ax)
    ax.set_xlim(100,108);ax.set_ylim(14,23)
    ax.set_title(c,fontsize=18)
    ax.axis('off')
    i+=1
plt.tight_layout()
f.savefig('thor_laos_cluster_bombs.jpg',dpi=150)
Personal comment
I visited Laos in 2012 and went to Phonsavan and the plain of Jars. I took the photo below after having nearly stepped on this unexploded bomblet while with a tour guide in a previously cleared area. Though these weapons are now 50 years old, some still do go off. This danger is faced daily by farmers in the affected areas. It’s not possible to look at a dry dataset such as this without thinking of the reality on the ground. De-mining efforts are ongoing with slow progress being made. Perhaps this dataset has been used to aid in the effort.
Unexploded cluster bomblet in Phonsavan area, Laos.