Plot fastq file metrics with Python
Background
Results from high throughput sequencing are saved as fastq format files. These contain millions of reads. Due to how sequencing chemistry works, reads will have varying levels of quality across their span, generally at the start and ends. The fastq file contains quality scores for each position of the read and plotting the distribution of qualities over a good sample of the reads is a primary way to decide whether to trim the reads or not. A popular program for viewing this and other metrics is FastQC, a Java program. It’s easy to use and produces a single html page of output. Here I show how to make some of those plots in Python with the Biopython and matplotlib packages.
Imports
import os
import math
import pylab as plt
import numpy as np
import pandas as pd
import matplotlib.patches as patches
Quality - phred scores
A Phred quality score is a measure of the quality of the identification of a base. So each read has a score along every position. The score measure can be used to filter reads by trimming or removal.
def plot_fastq_qualities(filename, ax=None, limit=10000):

    fastq_parser = SeqIO.parse(gzopen(filename, "rt"), "fastq")
    res=[]
    c=0
    for record in fastq_parser:
        score=record.letter_annotations["phred_quality"]
        res.append(score)
        c+=1
        if c>limit:
            break
    df = pd.DataFrame(res)
    l = len(df.T)+1

    if ax==None:
        f,ax=plt.subplots(figsize=(12,5))
    rect = patches.Rectangle((0,0),l,20,linewidth=0,facecolor='r',alpha=.4)
    ax.add_patch(rect)
    rect = patches.Rectangle((0,20),l,8,linewidth=0,facecolor='yellow',alpha=.4)
    ax.add_patch(rect)
    rect = patches.Rectangle((0,28),l,12,linewidth=0,facecolor='g',alpha=.4)
    ax.add_patch(rect)
    df.mean().plot(ax=ax,c='black')
    boxprops = dict(linestyle='-', linewidth=1, color='black')
    df.plot(kind='box', ax=ax, grid=False, showfliers=False,
            color=dict(boxes='black',whiskers='black')  )
    ax.set_xticks(np.arange(0, l, 5))
    ax.set_xticklabels(np.arange(0, l, 5))
    ax.set_xlabel('position(bp)')
    ax.set_xlim((0,l))
    ax.set_ylim((0,40))
    ax.set_title('per base sequence quality')
    return
Then calling the function as follows: plot_fastq_qualities(testfile,limit=100000) yields this plot:

Which we can compare to the same file analysed with FastQC below. Notice that this plot groups ranges in the center of the reads for easier reading and emphasizes the information at the ends. You can see this is clearer than our plot.

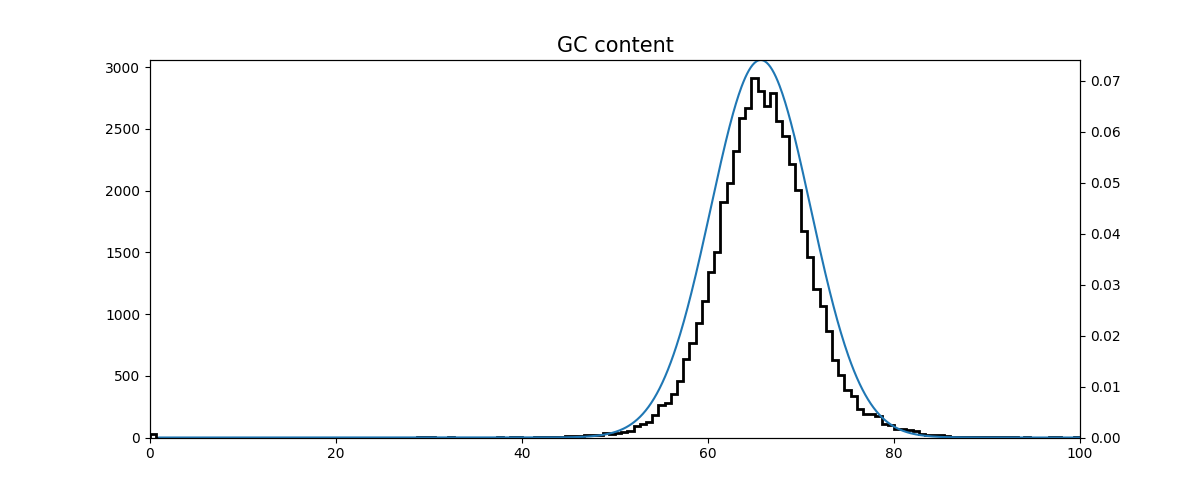
GC content
GC content can be a way to indicate contamination in an isolate. If the distribution of GC is skewed or bi-modal it may indicate that multiple species are present. FastQC has such a plot. Here we load the first n reads of the file into a dataframe for ease of computation. (Note that this method would not be optimal for loading an entire fastq file). We then calculate the GC with Bio.SeqUtils and plot the histogram along with a normal distribution using the same mean and variance for comparison.
def fastq_to_dataframe(filename, size=1000):
    """Convert fastq to dataframe.
        size: limit to the first reads of total size
        Returns: dataframe with reads
    """

    ext = os.path.splitext(filename)[1]
    if ext=='.fastq' or ext=='.gz':
        fastq_parser = SeqIO.parse(gzopen(filename, "rt"), "fastq")
    else:
        fastq_parser = SeqIO.parse(open(filename, "r"), "fastq")
    i=0
    res=[]
    for fastq_rec in fastq_parser:
        #print (fastq_rec.seq)
        i+=1
        if i>size:
            break
        res.append([fastq_rec.id, str(fastq_rec.seq)])
    df = pd.DataFrame(res, columns=['id','seq'])
    df['length'] = df.seq.str.len()
    return df

def normpdf(x, mean, sd):
    """sample a normal distribution at given point"""

    var = float(sd)**2
    denom = (2*math.pi*var)**.5
    num = math.exp(-(float(x)-float(mean))**2/(2*var))
    return num/denom

  def plot_fastq_gc_content(filename, ax=None, limit=50000):

      from Bio.SeqUtils import GC
      if ax==None:
          f,ax=plt.subplots(figsize=(12,5))
      df = fastq_to_dataframe(filename, size=limit)
      gc = df.seq.apply(lambda x: GC(x))
      gc.hist(ax=ax,bins=150,color='black',grid=False,histtype='step',lw=2)
      ax.set_xlim((0,100))
      x=np.arange(1,100,.1)
      f = [normpdf(i, gc.mean(), gc.std()) for i in x]
      ax2=ax.twinx()
      ax2.plot(x,f)
      ax2.set_ylim(0,max(f))
      ax.set_title('GC content',size=15)
      return