DataExplore - grouped plots in version 0.8.0
Plotting of grouped data has been improved in version 0.8. This is when you choose to group by a given categorical column (you can group by up to 2 columns) and then plot this data. There are then two ways to visualize the grouped data, in multiple or single plots.
Normal plots
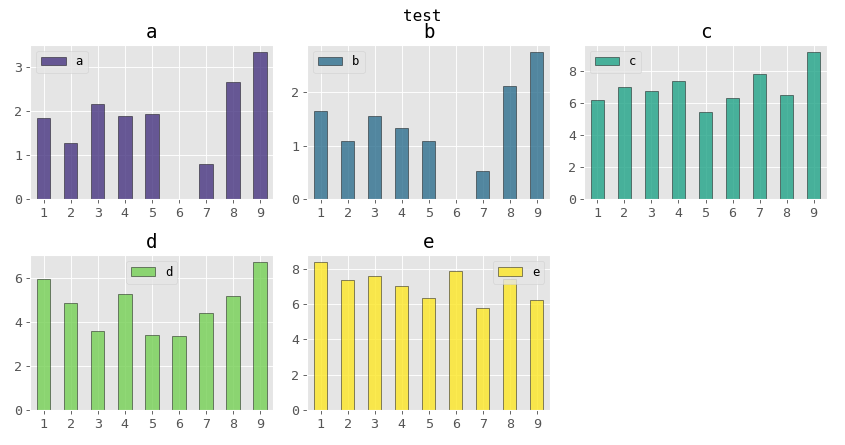
As an example, consider a portion of the sample data set available from the Datasets menu. This has a ‘label’ column with four different categories that we can group by. If we select say the first 10 rows or so and choose a normal bar plot we get the following plot where each column is a separate series and subplot:
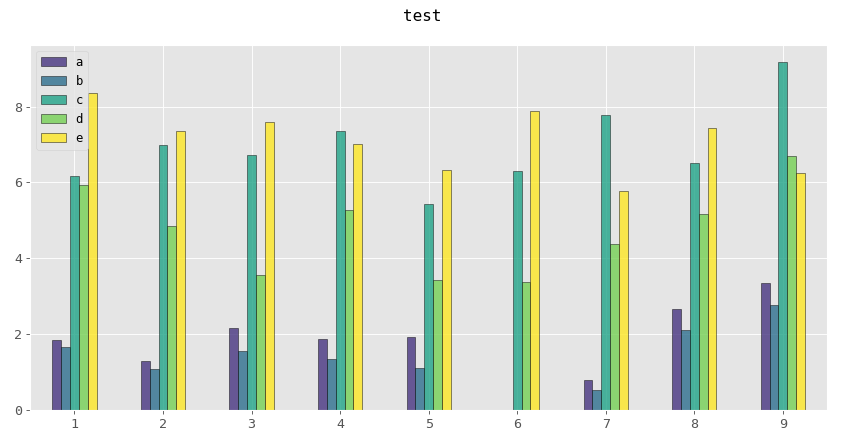
The above uses the ‘multiple subplots’ option. Switching this off gives a single plot with the columns grouped together for each row:
Grouped plots
In the above the label category is not used. We can now group the data by label by selecting the ‘label’ column in the first groupby combobox. Then re-plotting with multiple subplots on gives this:

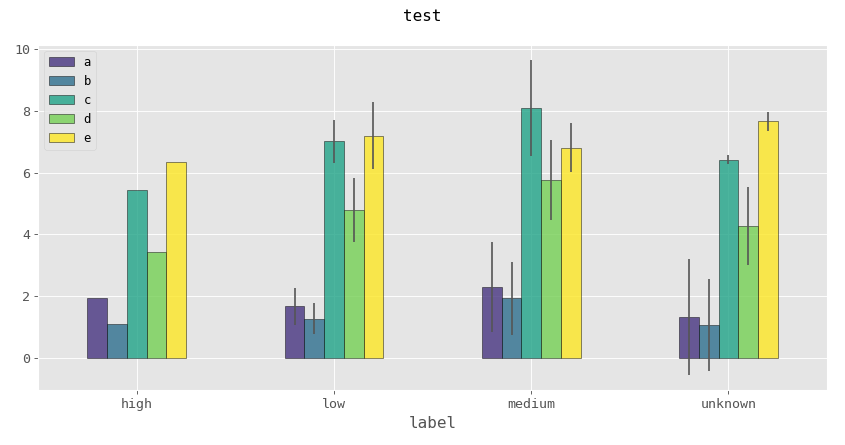
Finally, switching to a single plot treats the data in a summary fashion since this is likely the most meaningful way to view such data in one plot. The column values are now the mean for each group with a bar showing the standard deviation. Note there are no bars for the ‘high’ group because only one row has that label.
Single grouped plots only work for line, bar and scatter types currently. Note that the above functionality is a simple form of the factor plotting in seaborn which is provided by the factor plots plugin. This is recommended for more complex use.
Shared axis scales in grouped plots
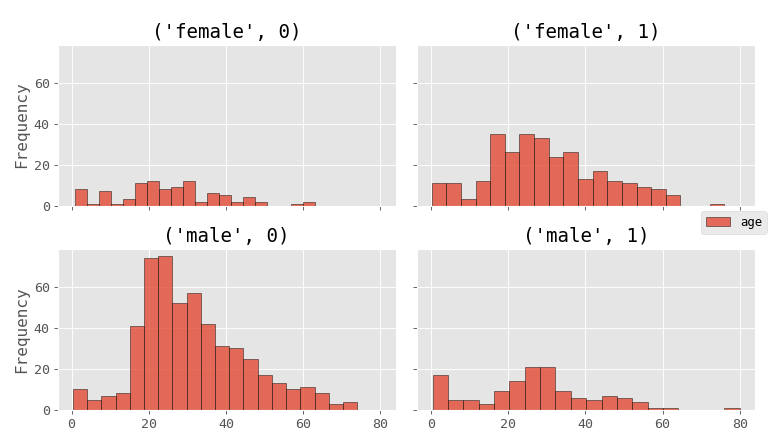
When plotting in groups with mutliple subplots the sharex and sharey options now work correctly. This allows you to scale the plots so they match in the x and/or y axis. An example is shown for the titanic dataset grouped by both sex and surivival columns at once. Select these and the age column first. If we plot a histogram of age we get this plot:
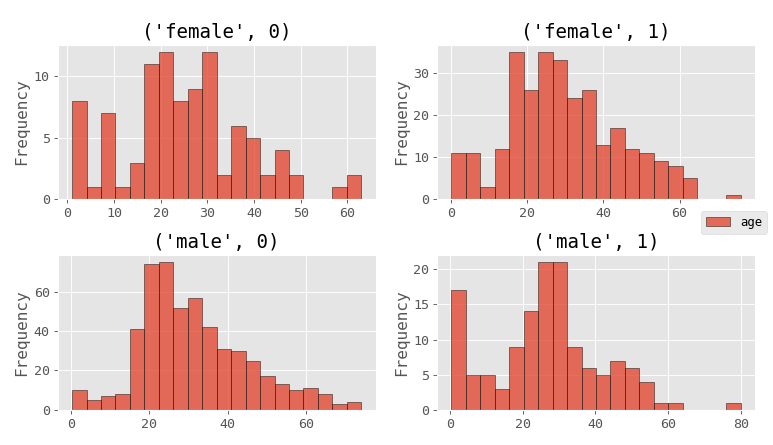
Now switching on ‘sharex’ and ‘sharey’ lets us see the numbers of each group in comparison to each other:
Links
Version 0.8.0 release page.