Simple MTBC regions of difference analysis with Python
Background
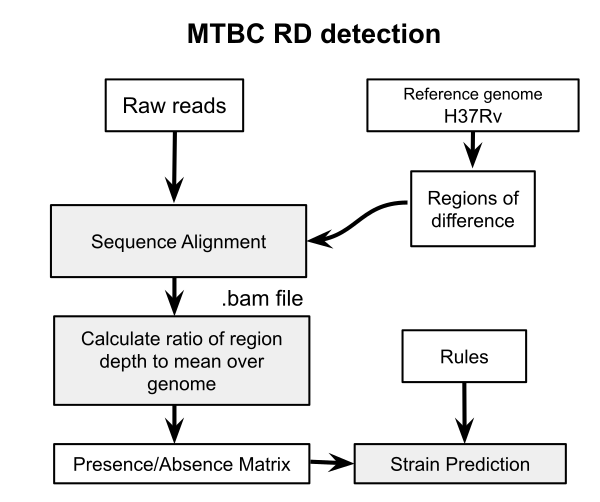
A previous post examined the use of nucdiff for detecting regions of difference (RD) for delineating members of the M. tuberculosis complex (MTBC). This works by assembling sequencing reads into a draft genome and aligning to the reference H37Rv genome with Mummer. While this may be useful for discovery of novel deletions and other structural changes, it has accuracy problems in known RD detection because of the quality of the genome assembly. In particular, short reads of 50-100 bp will cause problems in correctly identifying if a region is missing or not. The more obvious approach is to align the raw reads to the individual RD sequences and then determine presence using the coverage in each alignment. This is how RD-Analyzer works. Since I could not quite get this program working I have implemented a version of it here. It has not been thoroughly benchmarked.
RD-Analyzer
The RD-Analyzer method is explained in detail in the BMC genomics paper. “The input sequence reads are mapped to reference RD sequences, after which read depths along the reference sequences would be calculated. Normally, an RD is identified as ‘present’ in the MTC isolate if the median ratio of read depth along the reference sequence is above a specified threshold”. Here I implement a somewhat simplified version of the same method. We first extract all the RD sequences using the coordinates from the file RD.csv, you can find this file here. Then the reads are aligned to these sequences and the coverage calculated for each. A threshold is applied (0.15 here) to this value to determine if that region is present. These are stored in a matrix of 1 and 0 values for all regions and isolates.
Code
import sys,os,subprocess,glob,shutil,re,random
import numpy as np
import pandas as pd
import pylab as plt
import tempfile
from Bio import SeqIO
from Bio.Seq import Seq
from Bio.SeqRecord import SeqRecord
from pyfaidx import Fasta
mtbref = 'MTB-H37Rv.fa' #reference genome

def bwa_align(file1, file2, idx, out, threads=4, overwrite=False):
    """Align reads to a reference with bwa.
    Args:
        file1, file2: fastq files
        idx: bwa index name
        out: output bam file name
    """

    bwacmd = 'bwa'
    samtoolscmd = 'samtools'
    if file2 == None:
        file2=''
    cmd = '{b} mem -M -t {t} {i} {f1} {f2} | {s} view -F 0x04 -bt - | \
        {s} sort -o {o}'.format(b=bwacmd,i=idx,s=samtoolscmd, f1=file1,f2=file2,o=out,t=threads)
    if not os.path.exists(out) or overwrite == True:
        print (cmd)
        tmp = subprocess.check_output(cmd, shell=True)
    return

def create_rd_index(names=None):
    """Get RD region sequence from reference and make bwa index"""

    RD = pd.read_csv('RD.csv')
    df = RD.set_index('RD_name')
    if names!= None:
        df=df.loc[names]
    seqs=[]
    for name, row in df.iterrows():
        rg = Fasta(mtbref)
        sseq = rg['NC_000962.3'][row.Start:row.Stop].seq
        #refname = '%s.fa' %name
        seqs.append(SeqRecord(Seq(sseq),id=name))
    SeqIO.write(seqs, 'RD.fa', 'fasta')
    aligners.build_bwa_index('RD.fa')

def find_regions(df, path):
    """Align reads to regions of difference and get coverage stats."""

    from io import StringIO
    from pyfaidx import Fasta
    ref = 'RD.fa'
    rg = Fasta(mtbref)
    res = []
    for i,g in df.groupby('sample'):
        out=os.path.join(path,i+'.bam')
        f1 = g.iloc[0].filename; f2 = g.iloc[1].filename
        if not os.path.exists(out):
            bwa_align(f1, f2, ref, out, threads=4, overwrite=False)

        #get the average sequencing depth
        cmd = 'zcat %s | paste - - - - | cut -f2 | wc -c' %f1
        tmp = subprocess.check_output(cmd,shell=True)
        avdepth = int(tmp)*2/len(rg)
        print (avdepth)
        cmd = 'samtools coverage --min-BQ 0 %s' %out
        tmp = subprocess.check_output(cmd,shell=True)
        s = pd.read_csv(StringIO(tmp.decode()),sep='\t')
        s['name'] = i
        #get the mean ratio
        s['ratio'] = s.meandepth/avdepth
        res.append(s)
    res = pd.concat(res)
    return res

def get_matrix(res, cutoff=0.15):
    """Get presence/absence matrix for RDs"""

    X = pd.pivot_table(res,index='name',columns=['#rname'],values='ratio')
    X=X.clip(lower=cutoff).replace(cutoff,0)
    X=X.clip(upper=cutoff).replace(cutoff,1)
    X=X.sort_values(by=X.columns[0])
    return X

def plot_rd_matrix(df):
    """Plot matrix of rd regions"""

    fig, ax = plt.subplots(figsize=(15,6))
    im = ax.imshow(df)
    ax.set_xticks(np.arange(len(df.columns)))
    ax.set_yticks(np.arange(len(df)))
    ax.set_xticklabels(df.columns)
    ax.set_yticklabels(df.index)
    plt.setp(ax.get_xticklabels(), rotation=80, ha="right",
             rotation_mode="anchor")
    plt.tight_layout()
    return

def apply_rules(x):
    """Identify isolate using RD rules"""

    if x.RD239 == 0:
        return 'L1'
    elif x.RD105 == 0:
        return 'L2'
    elif x.RD4 == 1:
        if (x.RD1mic == 0):
            return 'Microti'
        elif (x.RD12bov == 0 or x.RD1bcg == 0 or x.RD2bcg == 0):
            return 'Caprae'
    elif x.RD4 == 0:
        if x.RD1bcg==1 and x.RD2bcg==1 and x.RD12bov == 0:
            return 'Bovis'
        elif x.RD1bcg==0 and x.RD2bcg==1:
            return 'BCG (Moreau)'
        elif x.RD1bcg==0 and x.RD2bcg==0:
            return 'BCG (Merieux)'
    elif x.RD711 == 0:
        return 'Africanum'
The input to find_regions is a dataframe of the form:
sample	filename	pair
ERR027294	ERR027294_1.fastq.gz	1
ERR027294	ERR027294_2.fastq.gz	2
ERR234151	ERR234151_1.fastq.gz	1
ERR234151	ERR234151_2.fastq.gz	2
find_regions returns a dataframe in long form that we can pivot to get the final matrix. get_matrix does this and also clips the values at the threshold to find presence/absence.
To run the method we call:
create_rd_index()
res = find_regions(df, outpath)
X = get_matrix(res)
plot_rd_matrix(X)
This will produce a colormap of the form below. Here some read data for known test samples is used to show the results for different species.
Finally we can use the apply_rules method to identify unknown samples from the RD patterns in the matrix:
X.apply(apply_rules,1)
Note that this method is not quite complete as it doesn’t properly handle the RDoryx_wag22 deletion that identifies M.Orygis and the pks15/1 region needs to be treated specially. Also the rules function needs to be completed.
The up to date version of this code can be found here
Links
References
- C. Loiseau et al., “An African origin for Mycobacterium bovis,” Evol. Med. Public Heal., pp. 49–59, 2020.
- Faksri, Kiatichai et al. “In silico region of difference (RD) analysis of Mycobacterium tuberculosis complex from sequence reads using RD-Analyzer.” BMC genomics vol. 17,1 847. 2 Nov. 2016, doi:10.1186/s12864-016-3213-1
- Mostowy S, Inwald J, Gordon S, et al. Revisiting the evolution of Mycobacterium bovis. J Bacteriol. 2005;187(18):6386–6395. doi:10.1128/JB.187.18.6386-6395.2005
- K. M. Malone and S. V. Gordon, “Strain Variation in the Mycobacterium tuberculosis Complex: Its Role in Biology, Epidemiology and Control,” in Adv. Exp. Med. Biol., vol. 1019, 2017, pp. 79–93.

