NucDiff for bacterial whole genome comparisons
Background
Entire genome sequences are now routinely generated from bacterial isloates with whole genome sequencing. This has many applciations in the research domain e.g. genetics and species evolution. It also has clinical application such as in strain identification for diagnostic use. Once a genome is sequenced you can assemble it into contigs using a de novo assembler like SPAdes. Finishing the genome requires a bit more effort, but either way you can still perform comparisons. There are multiple ways to compare genomes:
- Whole genome comparisons
- Alignment to a reference and snp calling (without assembly)
- BLAST searches of target sequences to one or more of the genomes and comparing the results
This post is about the first of these methods. Comparing whole genomes is done in the form of many local alignments between matching segments. You can then see all (in theory) of the structural differences such as large insertions/deletions, between both genomes. This is subject to the quality of the assemblies of course. There are plenty of reasons why you will have some errors in the contigs such as the presence of mobile repeat elements. Sequencing errors also play a role. So you won’t see ALL differences between two genomes and might see some false positives.
MUMmer
MUMmer is a program for rapidly aligning entire genomes. They can be complete or draft assemblies (made up of contigs or scaffolds). MUMmer can handle 1000s of contigs and will align them to another genome/assembly using the NUCmer sub-program. It’s run as follows:
nucmer --coords -p nucmer ref.fa query.fa
show-coords -rclT query.delta
MUMmer is easy to use but the output is a bit confusing at first. The show-coords command produces a query.coords file which is in tabular format. It has a row for each alignment as below, with columns for positions, lengths percentage identity in both genomes.
[S1]	[E1]	[S2]	[E2]	[LEN 1]	[LEN 2]	[% IDY]	[LEN R]	[LEN Q]	[COV R]	[COV Q]	[TAGS]
1	1594	3337583	3335990	1594	1594	100.00	4411532	4378588	0.04	0.04	NC_000962.3	CP011510.1
1592	39069	3334634	3297177	37478	37458	99.88	4411532	4378588	0.85	0.86	NC_000962.3	CP011510.1
38983	71586	3297151	3264510	32604	32642	99.82	4411532	4378588	0.74	0.75	NC_000962.3	CP011510.1
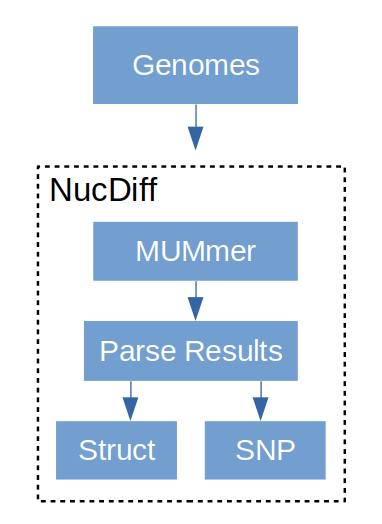
NucDiff
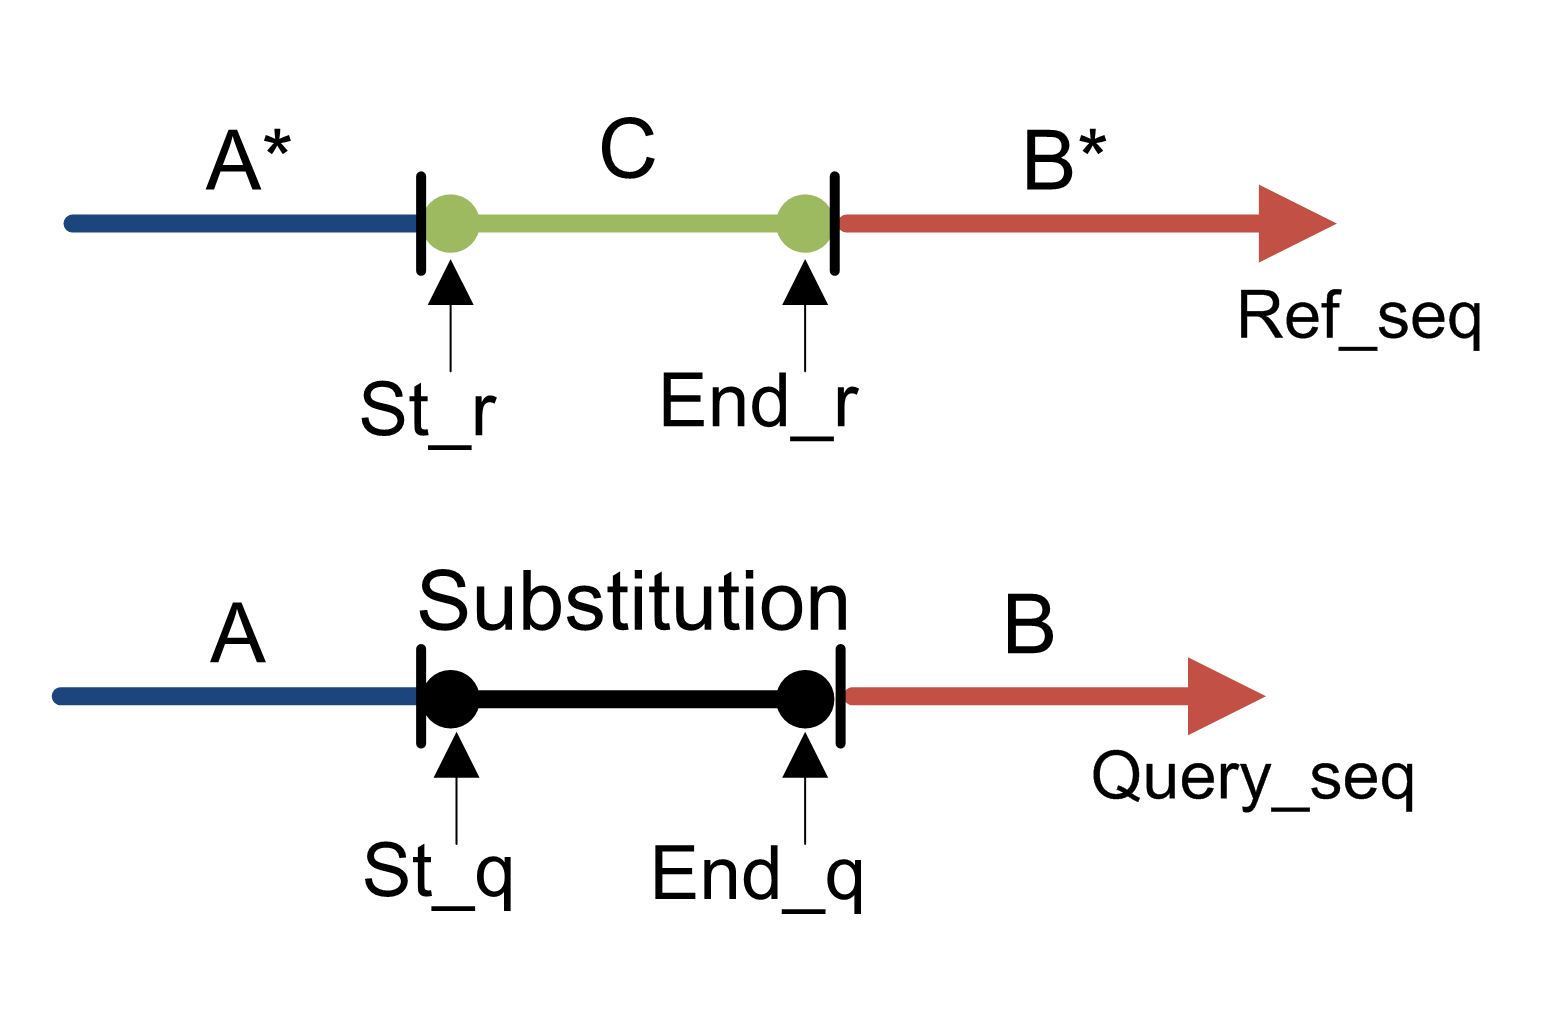
You can see that MUMmer makes output that’s fairly simple but might be hard to make sense of with many alignments. This is where NucDiff comes in. NucDiff runs MUMmer and uses the output to locate and categorize differences between two closely related genomes. It will group changes as structural rearrangements, various types of local differences and so on and then produce gff files which can be visualised in a genome browser like IGV. The types of differences are explained in the NucDiff wiki. An example is given here of a substitution. This is a replacement of a region in the reference with another sequence of the same exact length not present anywhere in the reference genome. In the gff results the category of change will be marked and colored accordingly.
Example: H37Rv vs Beijing
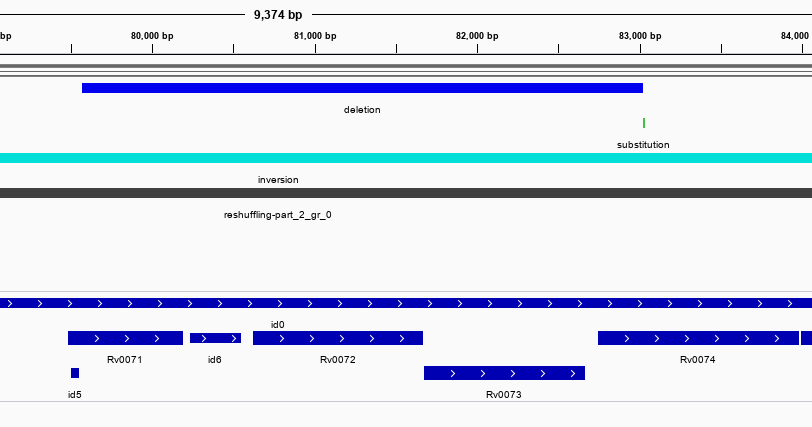
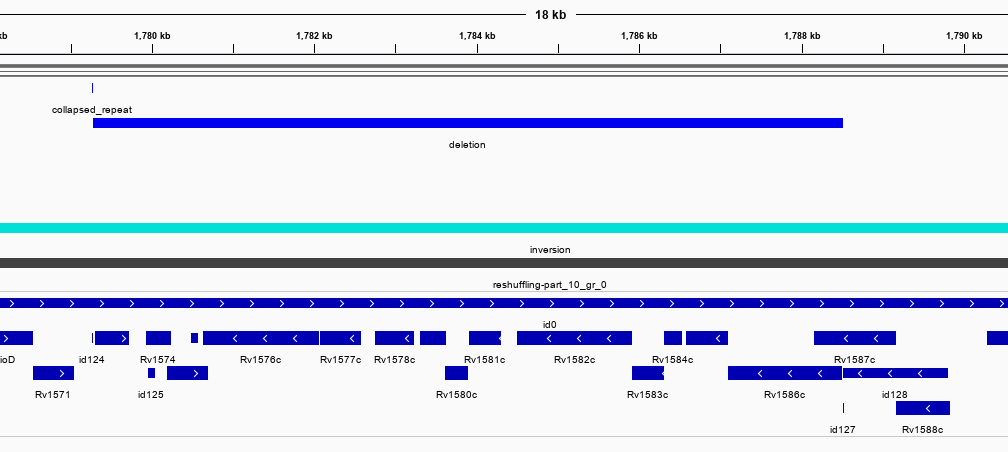
As an illustration we use a comparison between two strains of Mycobacterium tuberculosis: H37Rv and an isolate of the MTB-Beijing strain. These are largely identical across the genome, which is what NucDiff is designed for. The genomes differ through a series of (roughly 20) sequence polymorphisms ranging from ~200 to 14000 bp in size (Tsolaki et al.). These are mainly deletions in Beijing compared to H37Rv. Once we run NucDiff we can inspect these structural changes in the gff file saved in the results folder. There is a seperate gff for SNPs also. The screenshots below show two of the regions viewed in IGV along with the H37Rv genome annotations (genes at bottom). We can see that NucDiff has detected two deletions in these regions and these correspond to regions RD10 and RD149.
RD10: 79567-83034 (Rv0071-Rv0074)
RD149: 1779264 1788512 (Rv1572c-Rv1586c)
In fact there are four common deletions (RD105, RD149, RD152, and RD207) found in all Beijing/W strains and an inspection of the results shows these are all present. We can see how this tool can be used for strain identification from assemblies using known sequence differences. Novel polymorphisms common across multiple strains can also be readily discovered. Note that the output doesn’t produce a pairwise visual alignment of the genomes like Mauve, rather it’s designed to show the differences in gff format.
Links
References
- Tsolaki, Anthony G., et al. “Genomic deletions classify the Beijing/W strains as a distinct genetic lineage of Mycobacterium tuberculosis.” Journal of clinical microbiology 43.7 (2005): 3185-3191.