Seasonality of SARS-CoV-2
Background
As of Winter 2021, European countries are experiencing increases in COVID-19 case numbers, despite continued attempts at mitigation and suppression. Despite government insistence that it is due largely to behavioural reasons, they do not explain why cases fall dramatically in the Summer. The seasonal cycle of respiratory viral diseases is widely recognized. Seasonality is probably now the single overriding factor for the rise and fall of Covid related cases and deaths. Though there have been less than two full seasons of Sars-CoV-2 prevalence and limited data, it is appearing to be seasonal as it becomes endemic. Time will make this clearer. A study in GeoHealth found that in countries with temperate climates Covid-19 peaked during the winter months, when temperature and humidity were low. In countries with tropical climates the cases peaked during the summer monsoons, when humidity was high. This is seen for influenza and the reason is not fully understood. This doesn’t mean the virus disappears in warm weather but this has to be controlled for when trying to assess the effect of measures meant to reduce transmission.
Geographical region is important
Seasonality means that comparing any two countries is not really useful without at least controlling for this. This is shown below for 3 pairs of countries with close geographic locations and climates. Ireland and UK closely match in terms of curve shape. Is this because they both had lockdowns or simply because they are geographical neighbours? A better example might be Israel and Palestine which share a border. There is the same pattern but with a clear lag. The lag may partly be delays in reporting in Palestine but both countries showed the same pattern despite very different public health measures. Note that some large countries like the US will exhibit a mixture of seasonal periods from different regions. So the data will reflect a mixture of two seasonal signals.
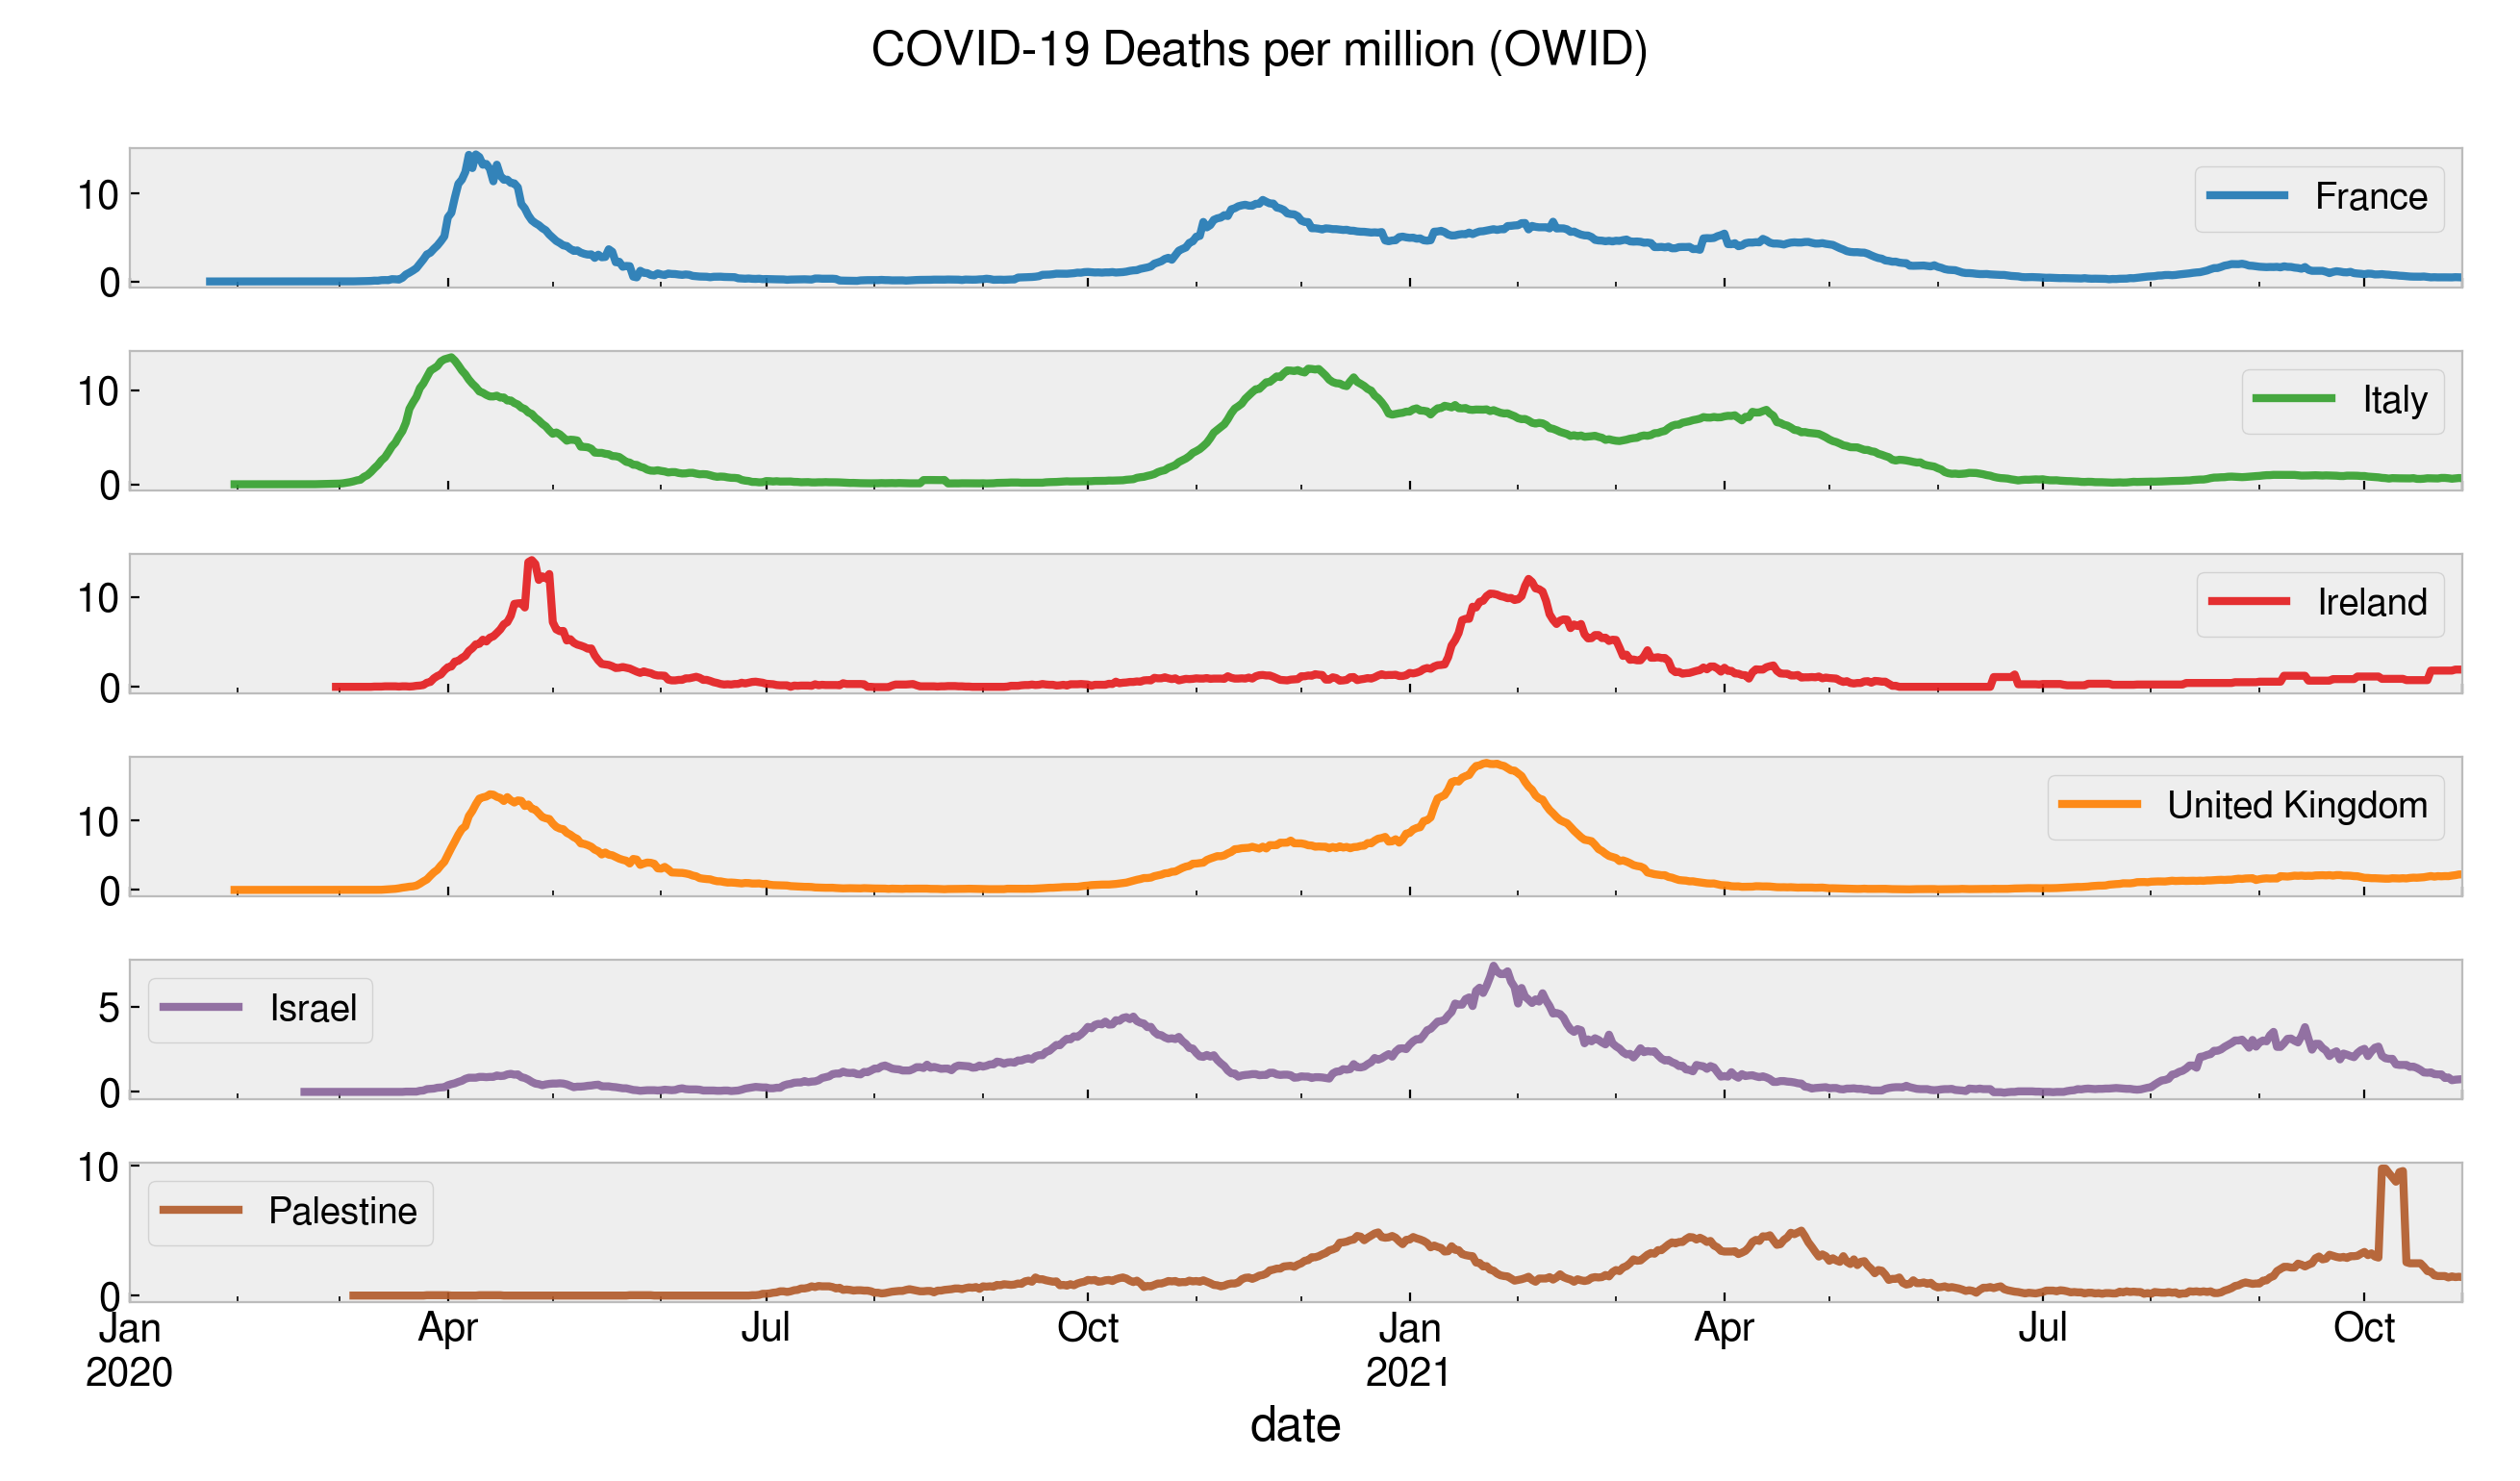
Changes in Covid related deaths for six countries are clearly seasonal.
Or take the following plot of three countries total Covid related deaths as they change over time. Each is plotted on it’s own scale so as to compare the shape of the curves which are approximately the same. Sweden did not impose many of the strict measures applied in the UK and Ireland, so why are waves of infection spread almost identical (even though total numbers may differ, which is a different comparison problem). The same patterns of seasonality are seen with all-cause mortality figures. There are other factors to be sure, but season is certainly a critical factor.
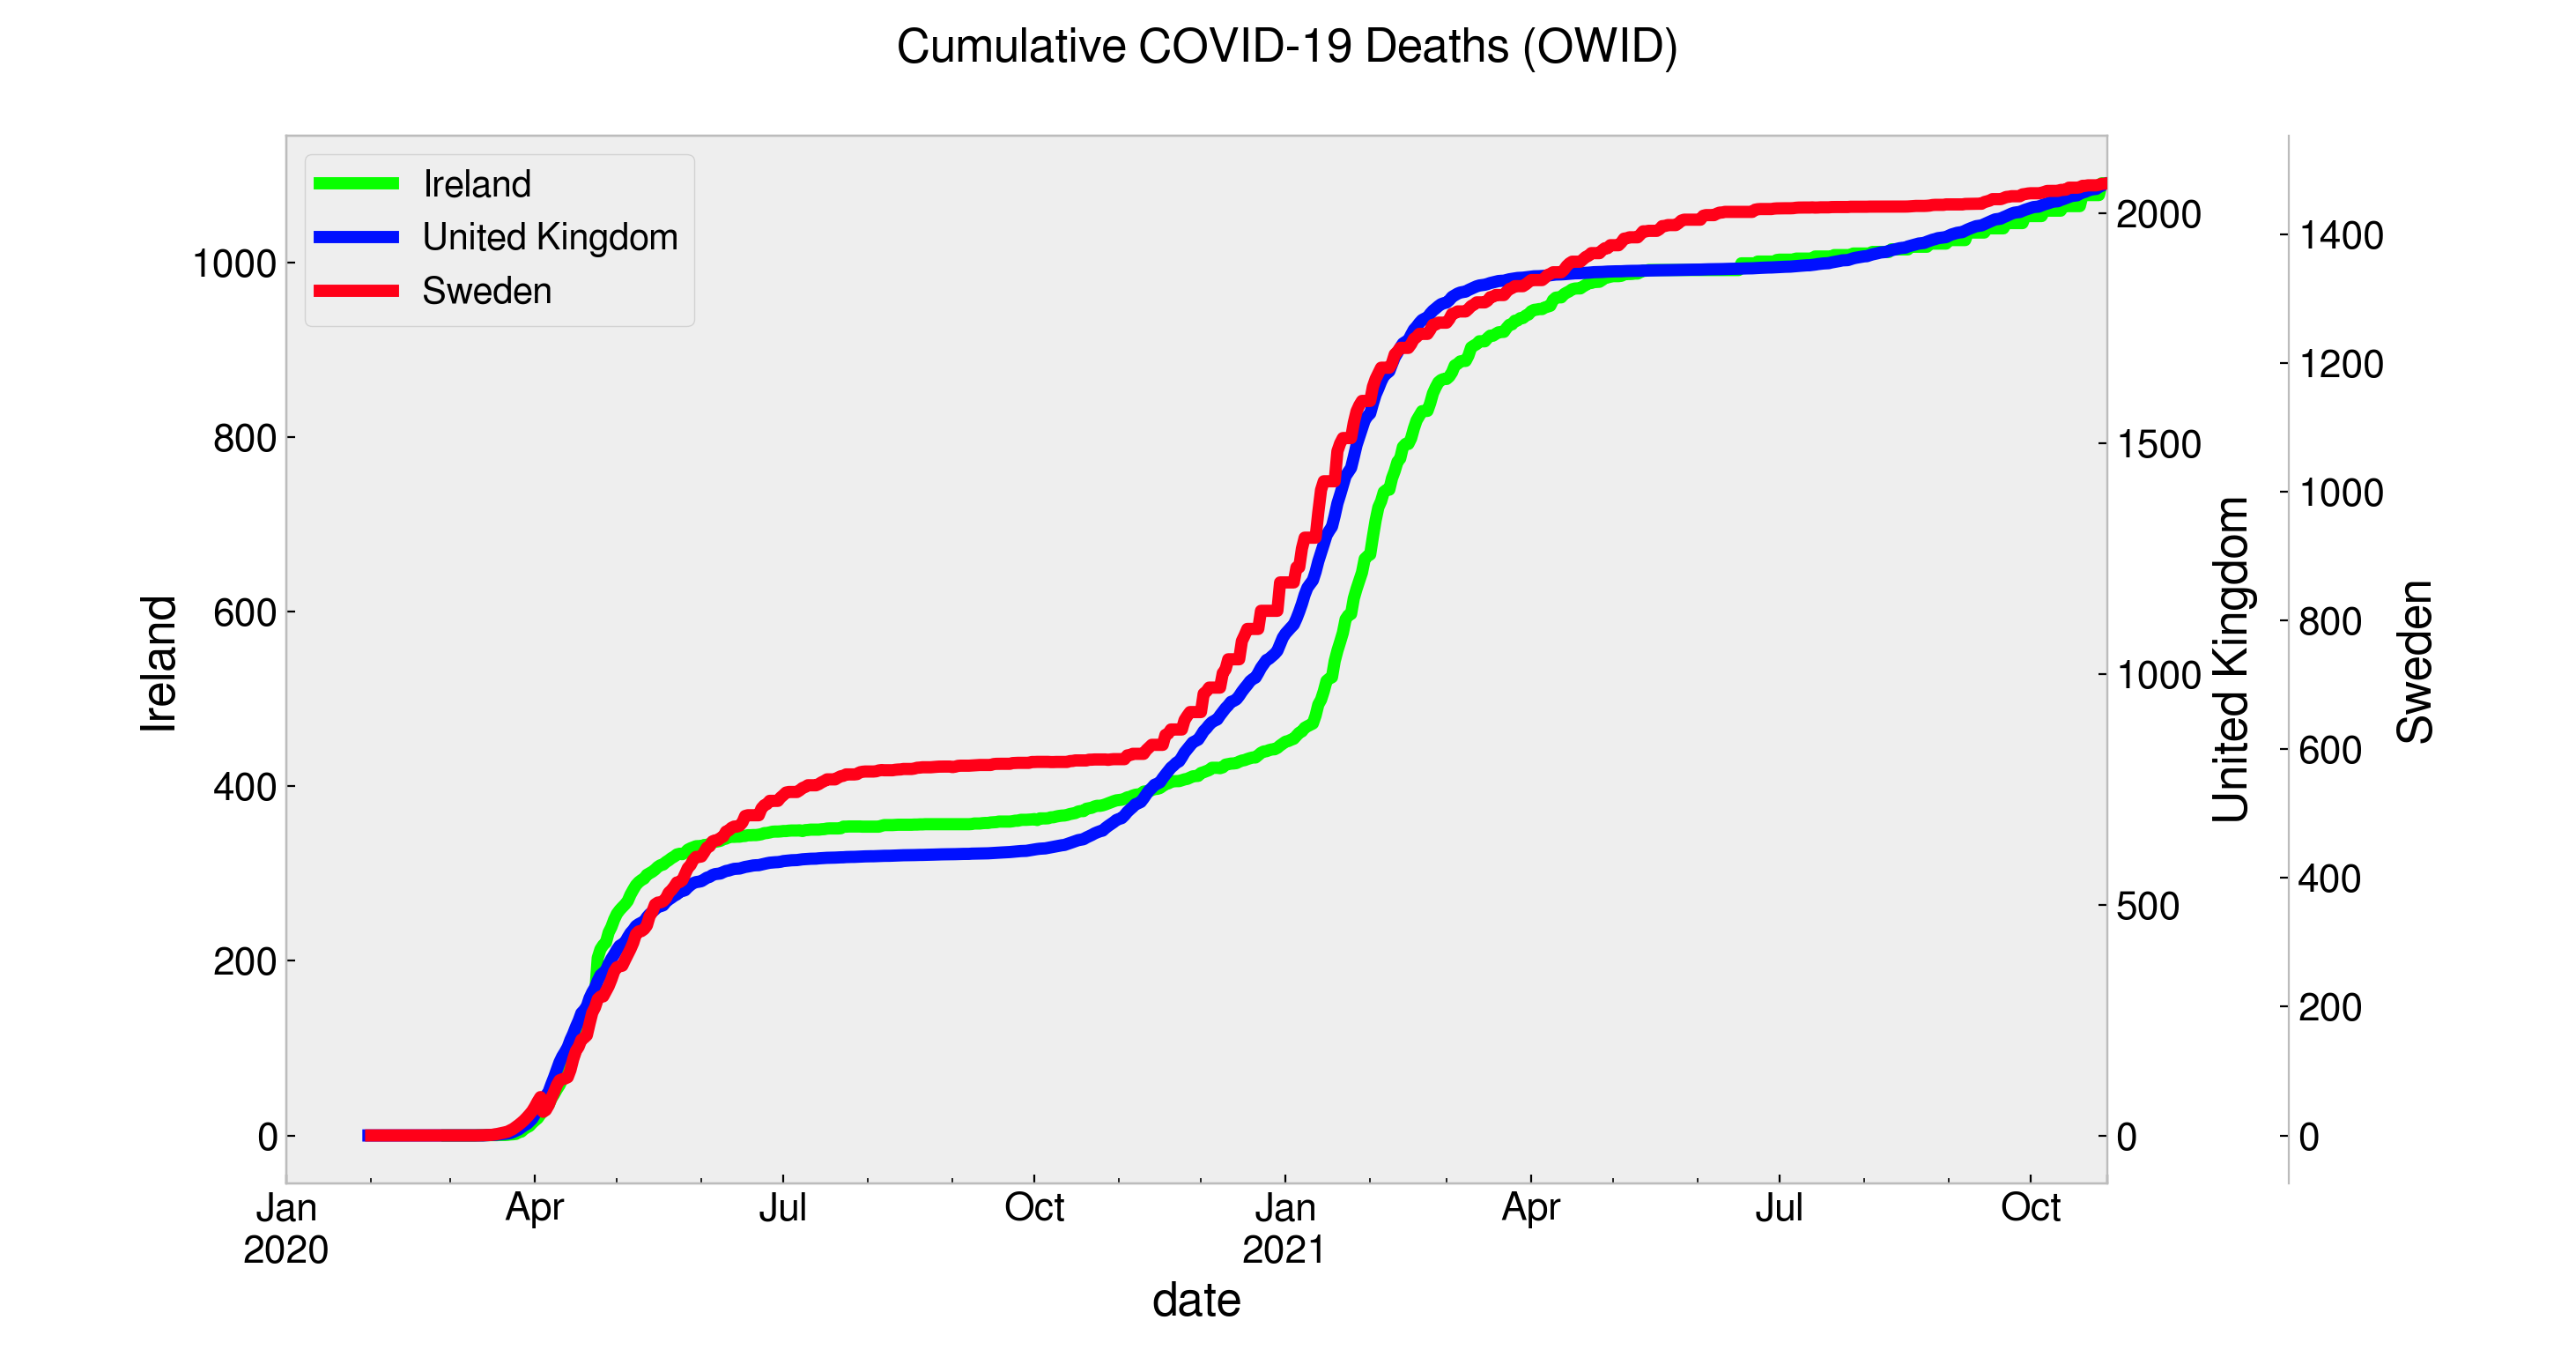
Cumulative Covid related deaths per million in Ireland, UK and Sweden.
USA
Another clear illustration is to look at the seasonal change in death rates in the continental United States. The maps below show average weekly death rates per county. Red are high and blue low with colors on a log scale to smooth the effect of outliers. Here we see a combination of at least two climactic regions affecting the timing of outbreaks. In August the Southern US is already experiencing its seasonal wave (left image) while the North has not started. The situation is more or less reversed by end of October in the right image.
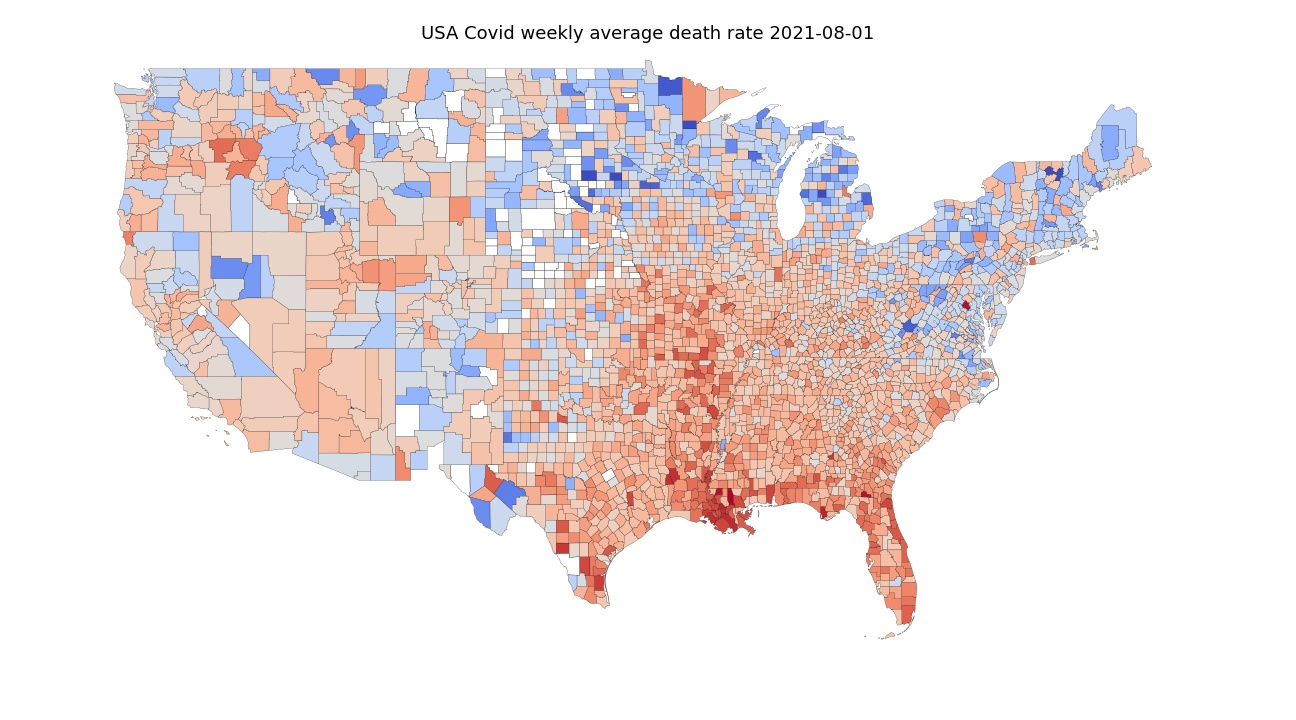
USA weekly average death rate per county for early August 2021.
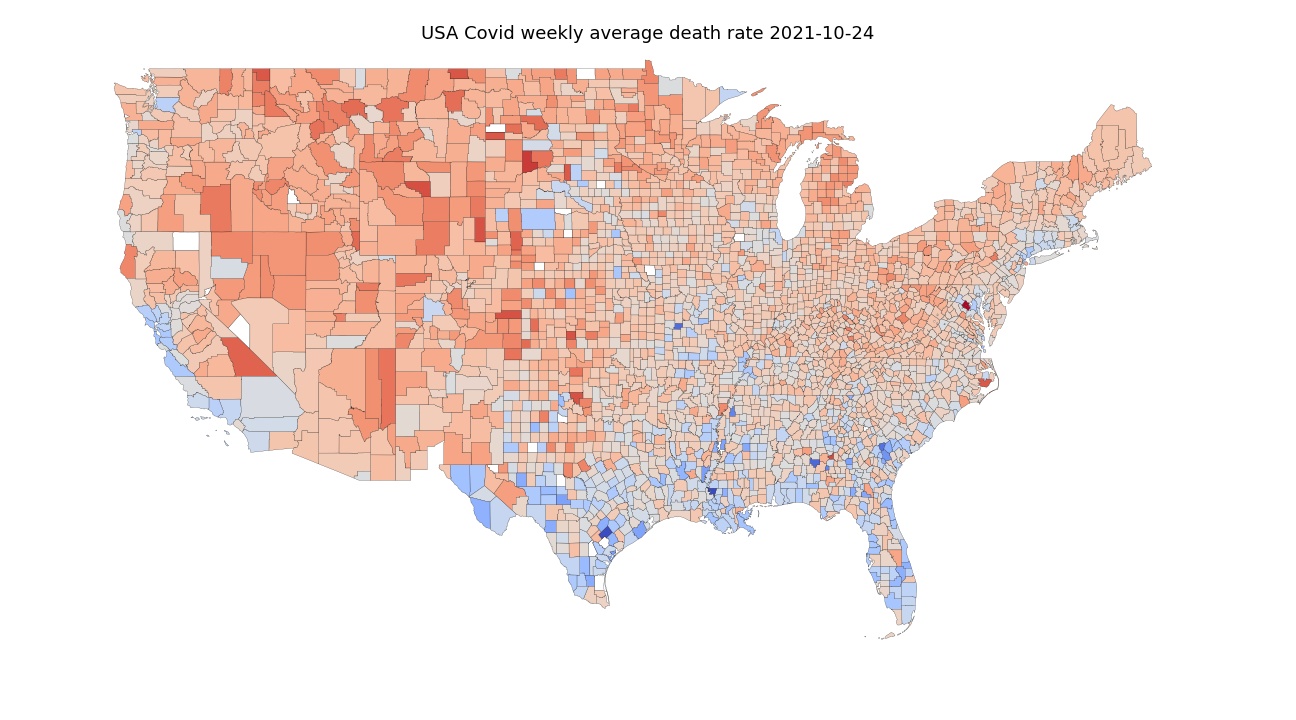
The same for late October 2021.
Cases are not a reliable metric
Why not use cases instead of deaths? Cases are a measure of positive PCR tests and are not a measure of impact of disease like hospital numbers and deaths. Though a proxy for viral prevalence they are loosely coupled to death rates, especially as population immunity rises. This is why the graph below of cases numbers for the same countries as above has different patterns to the deaths. It is more ‘noisy’ as it’s subject to multiple other factors like quantity of testing, groups being tested, the parts of the population undergoing outbreaks and even the definition of what constitutes a case. Notice that the UK appears to precede Ireland in cases, though the pattern is not exact.
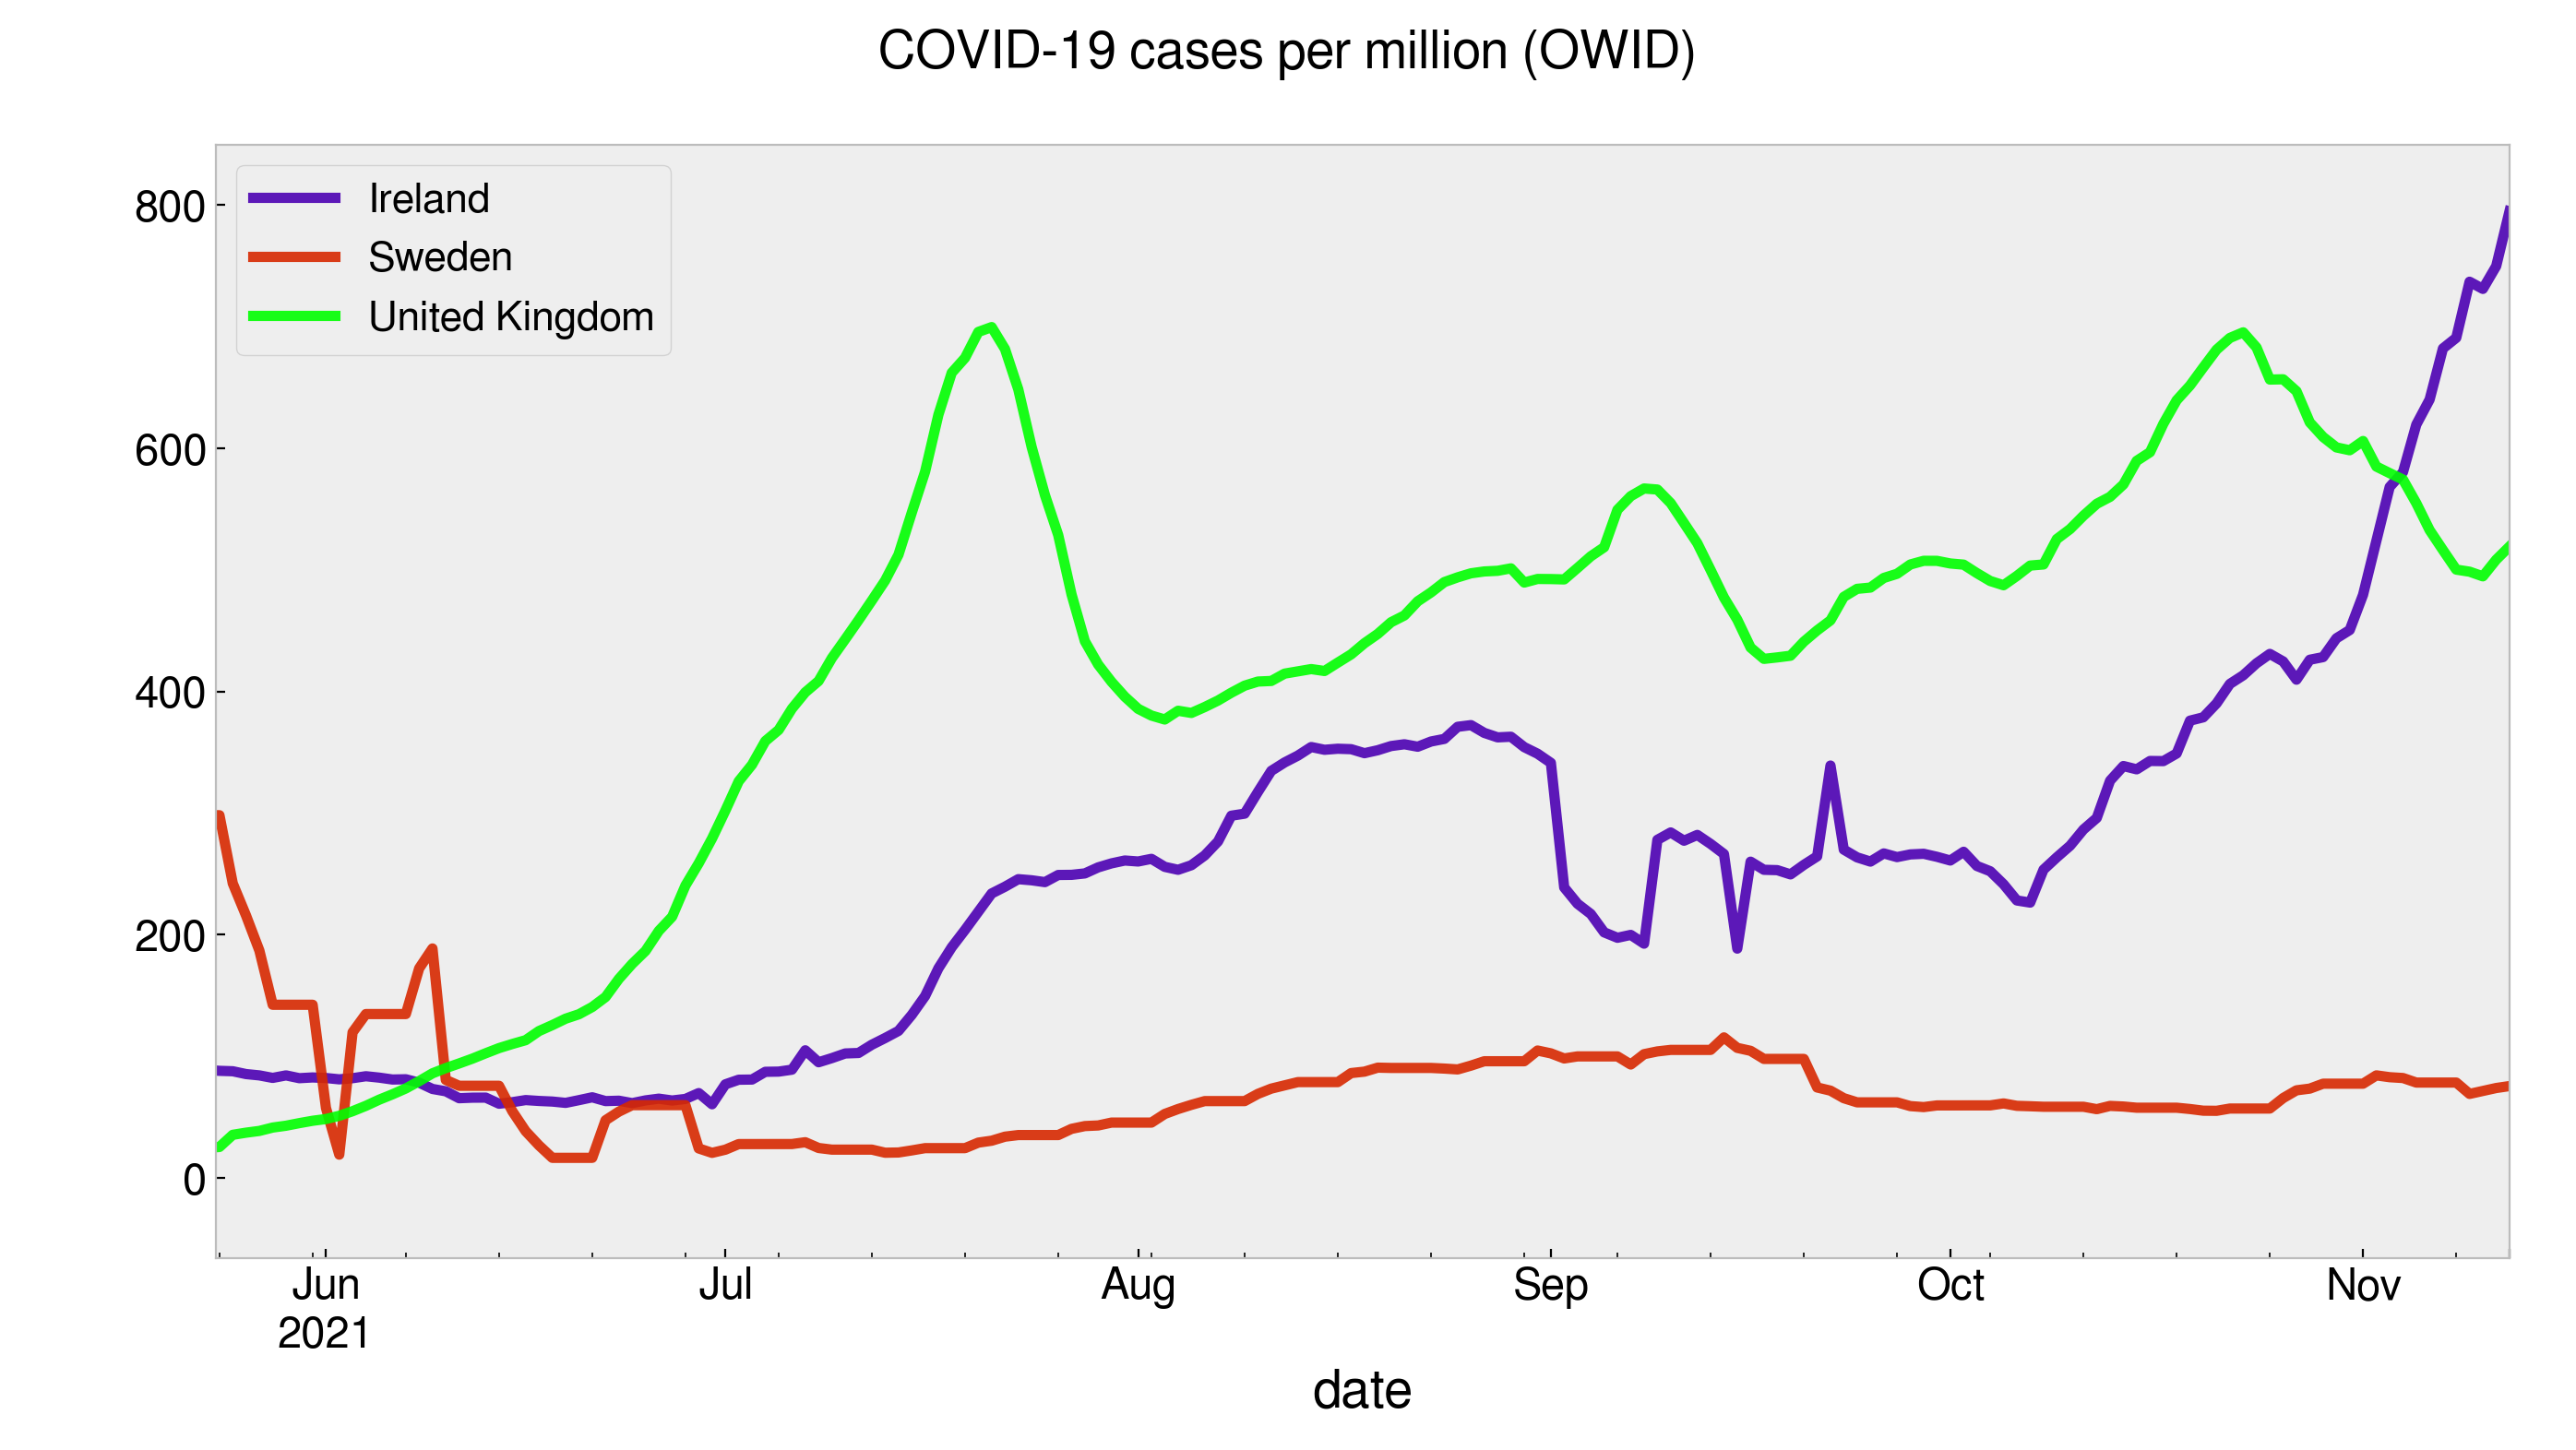
Changes in Covid cases per million for Ireland, UK and Sweden.