Categorical region plots with geopandas
Background
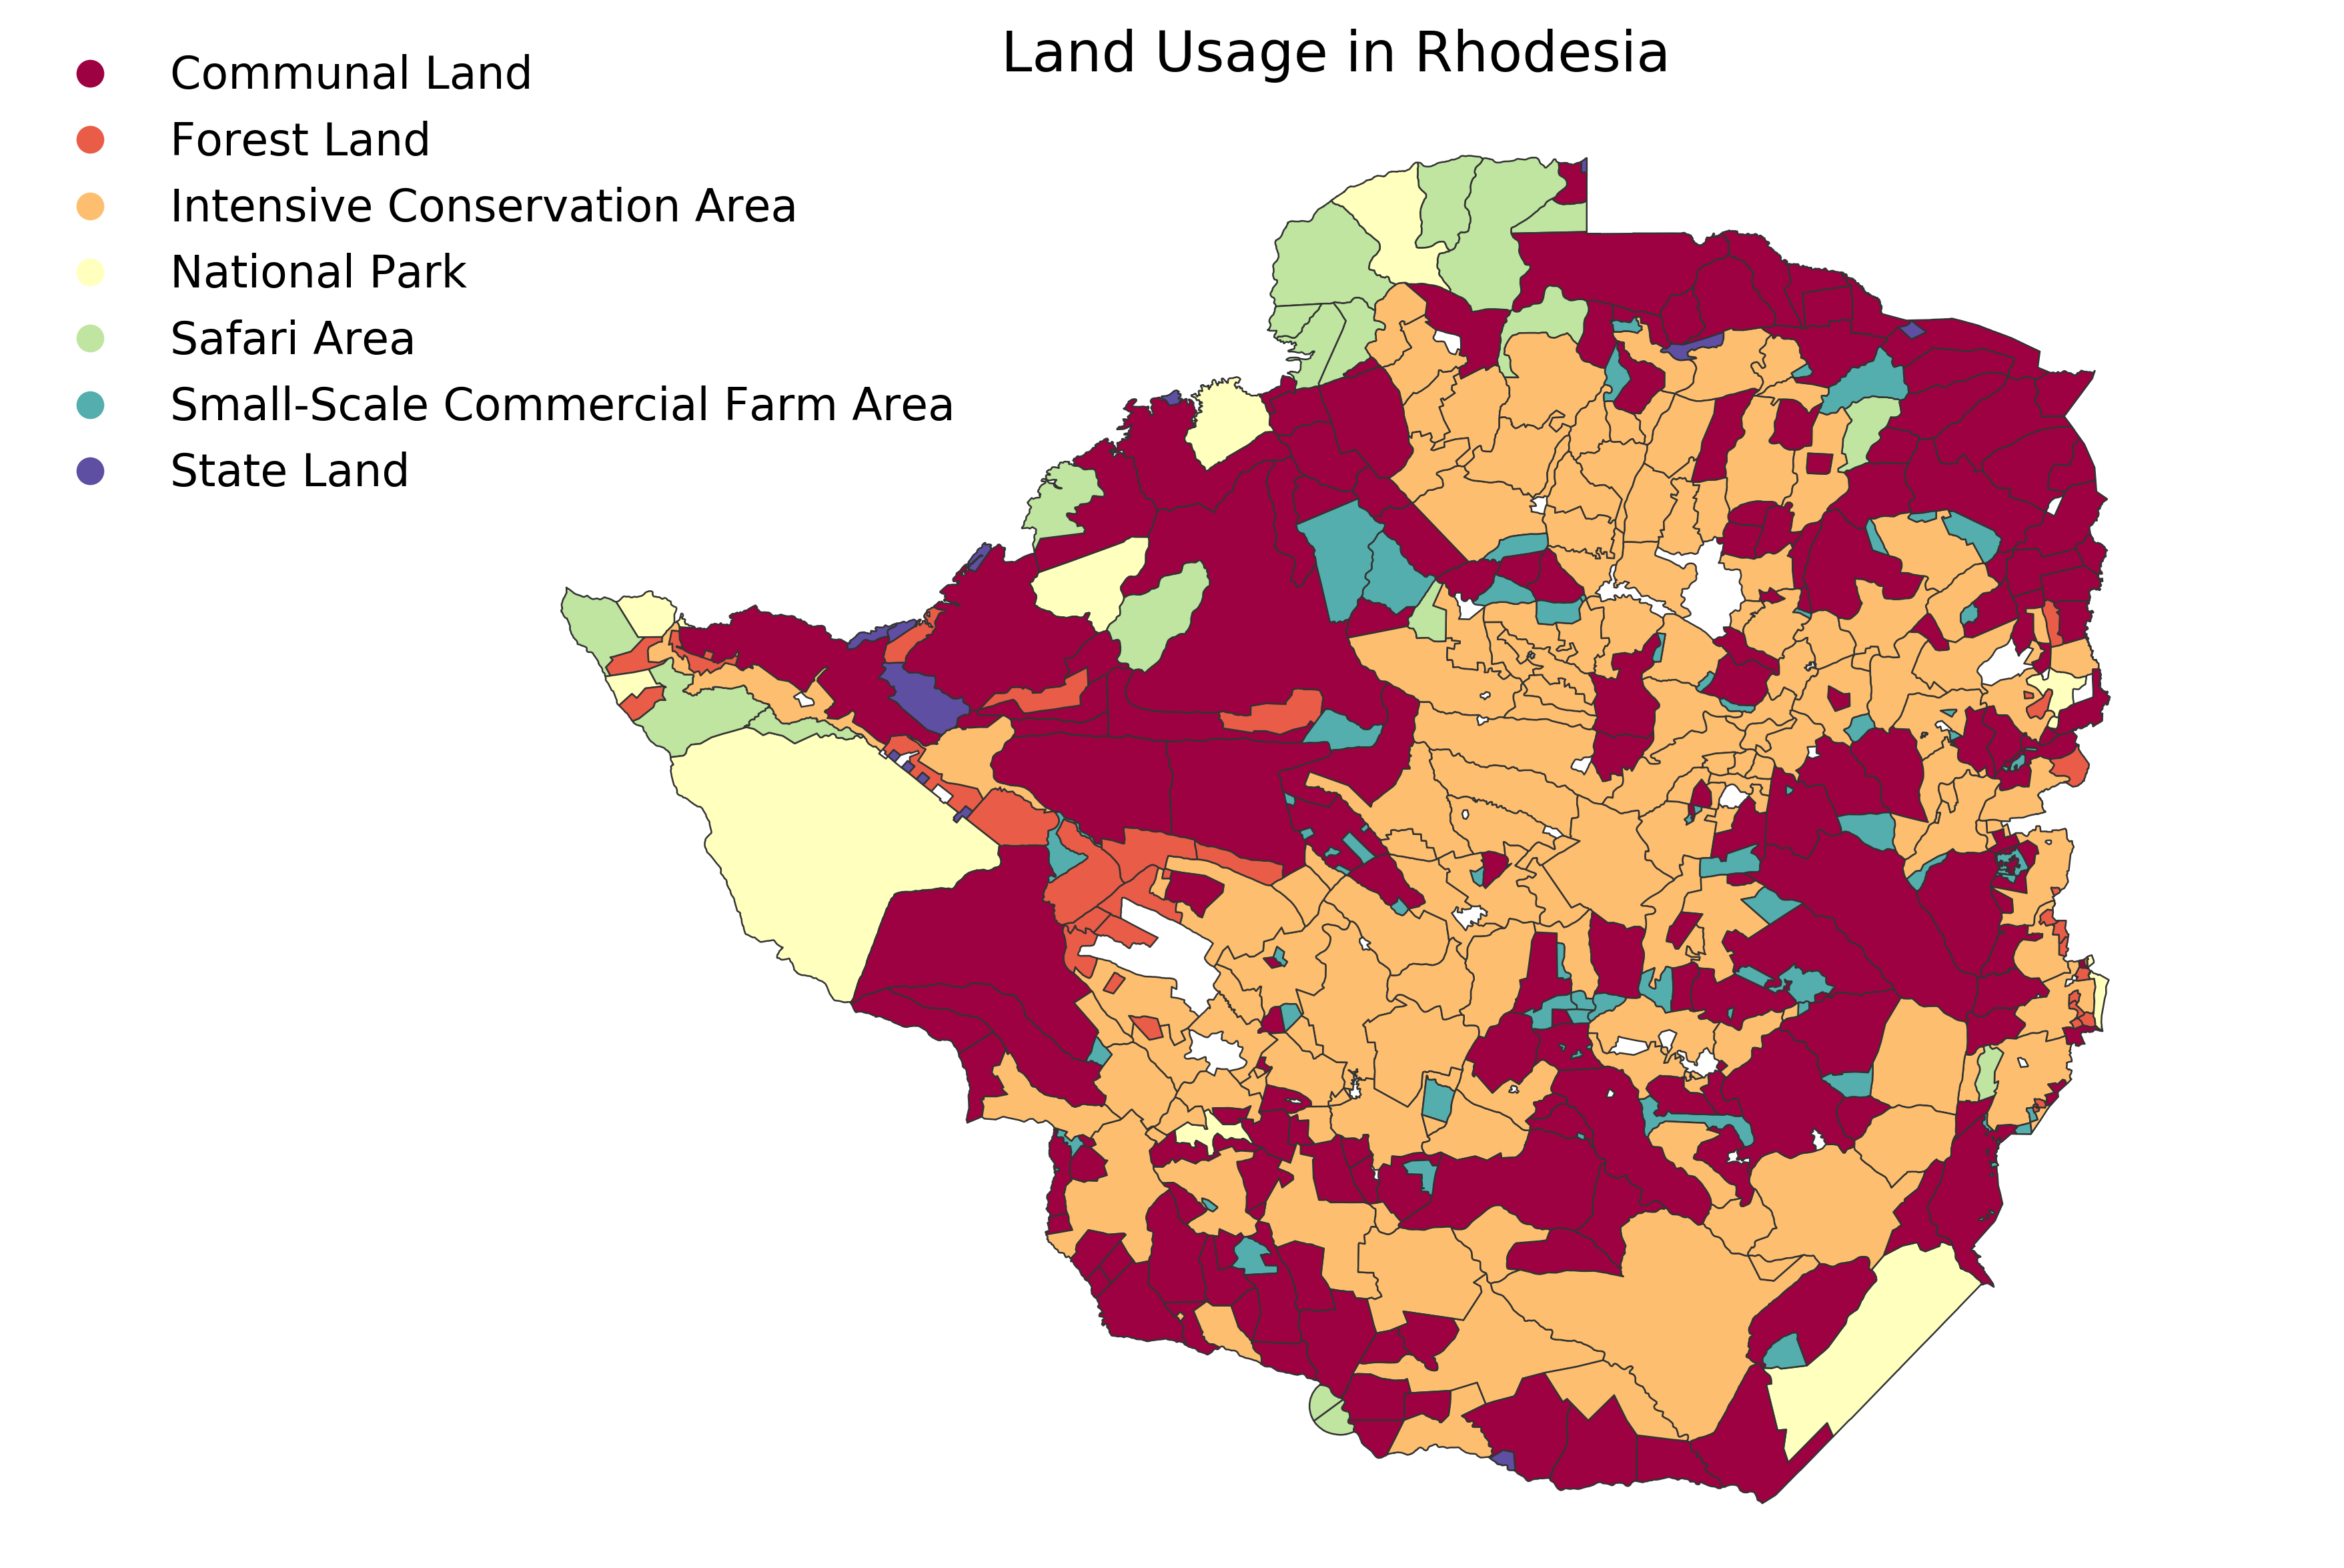
This post uses data from the zimspatial repo on historical land usage in the former Rhodesia (now Zimbabwe) in the pre-independence era. It’s simple to plot regions colored by categorical values rather than numerical ones. We simply provide the categorical=True keyword. The legend_kwds argument lets you customise the legend.
As shown previously, Geopandas objects can be plotted directly with matplotlib.
import pandas as pd
import geopandas as gpd
import json
import matplotlib as mpl
import pylab as plt

gdf = gpd.read_file('data/historic_land_classes.shp')
gdf = gdf.dropna()
fig, ax = plt.subplots(1, figsize=(14,8))
gdf.plot(column='class', categorical=True, cmap='Spectral', linewidth=.6, edgecolor='0.2',
         legend=True, legend_kwds={'bbox_to_anchor':(.3, 1.05),'fontsize':16,'frameon':False}, ax=ax)
ax.axis('off')
ax.set_title('Land Usage in Rhodesia',fontsize=20)
plt.tight_layout()
plt.savefig('images/rhodesia_land_classes.png',dpi=300)
Which produces the plot below:
You can compare that with this map of land apportionment circa 1965 from wikipedia.
