Embed Bokeh plots in Jekyll markdown
Background
As previously shown Bokeh can be used to plot choropleth maps. A major reason to use Bokeh is for interactivity. To deploy the plots you can run them in a Bokeh server instance but you need to have a server able to run Python in the background with the required packages installed. This is fine for local use but to use them in standalone pages online the plots need to be embdedded. You can quite easily do this in Jekyll, which uses Markdown to generate a blog such as this one.
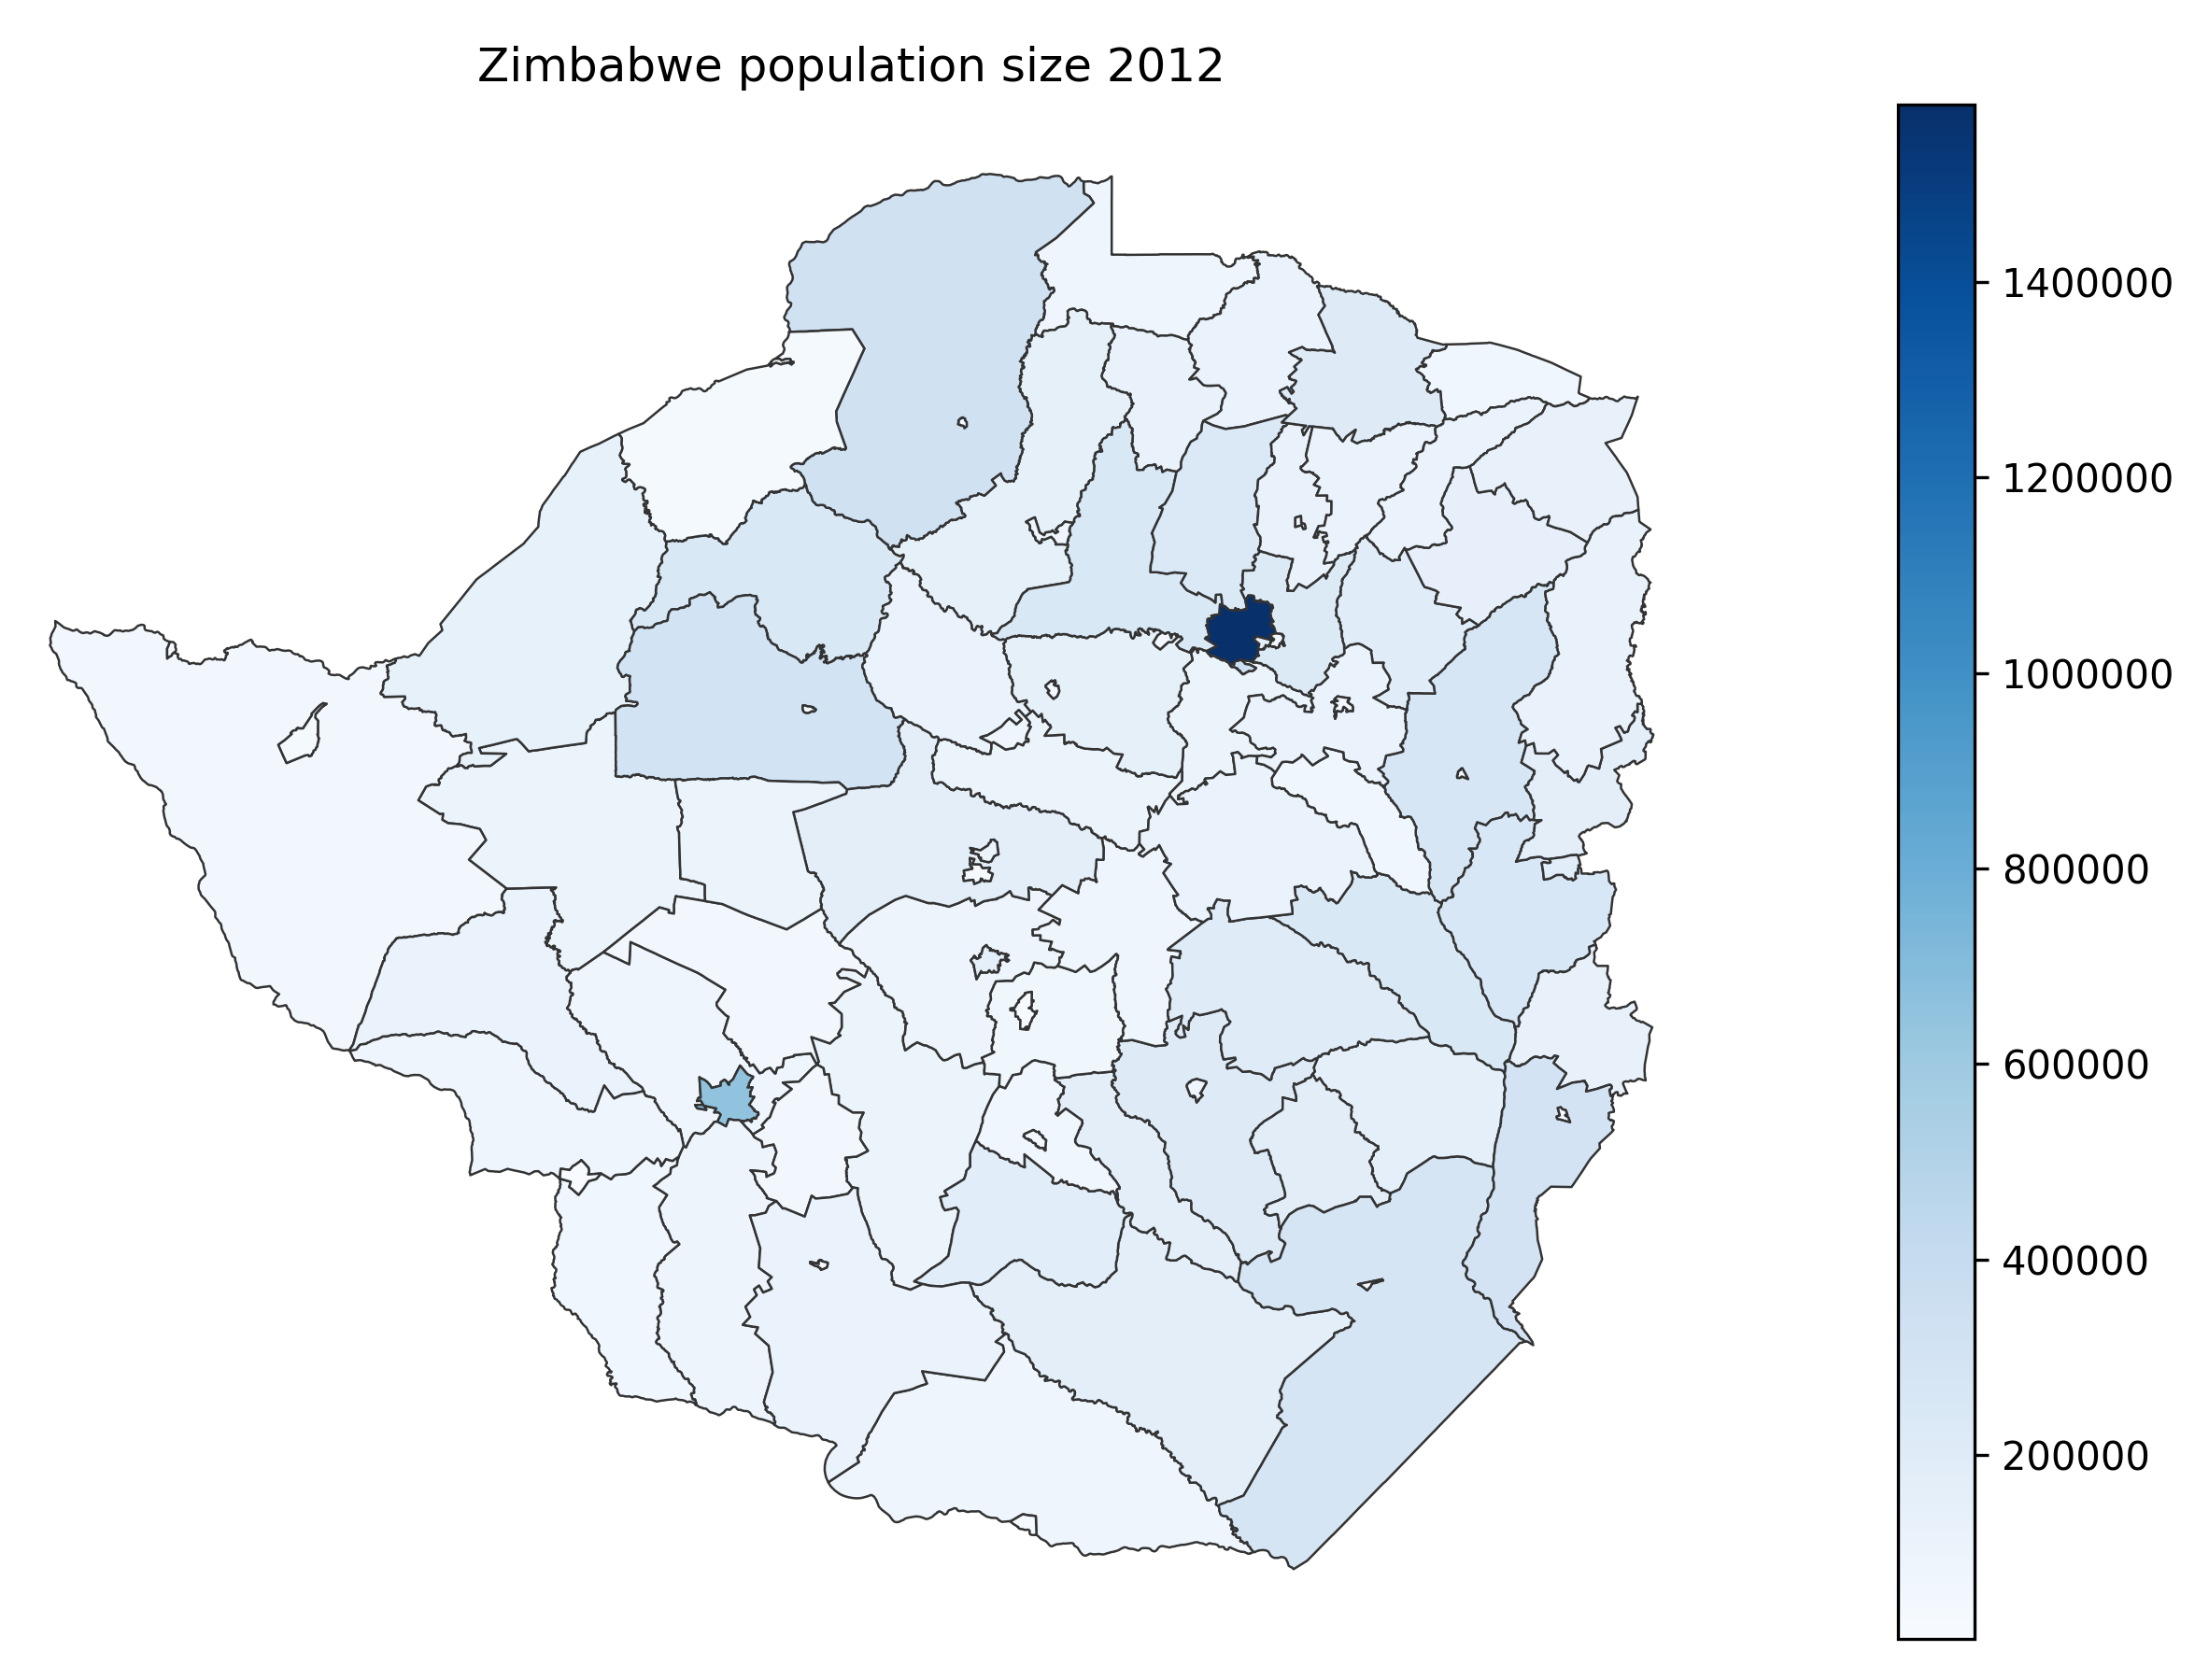
This is the plot made with matplotlib of populations per district in Zimbabwe c. 2012. (from the zimspatial repo). This is a static plot and you can’t see values for individual districts.
The same plot done in Bokeh allows us to use the hover tool to move the mouse over the map and view the population and name of district. The code for bokeh_plot_map is given in the previous post. To embed you simply generate the plot and use output_file to save it as a html page:
from bokeh.io import output_file, show,
geosource = get_geodatasource(dist)
#see code in previous post
p = bokeh_plot_map(geosource, column='pop_2012')
output_file('plot.html')
show(p)
The html in this page can then be put in the _includes folder of your Jekyll blog. It will include a <head> and <body> section that you can remove but make sure to include this part and that the code is not indented:
<link rel="stylesheet" href="http://cdn.pydata.org/bokeh/release/bokeh-1.4.0.min.css" type="text/css" />
<script type="text/javascript" src="https://cdn.pydata.org/bokeh/release/bokeh-1.4.0.min.js"></script>
<script type="text/javascript">
    Bokeh.set_log_level("info");
</script>
Also ensure that the version of Bokeh included is sufficient for your script. Old versions might not work with certain code. Finally to insert the bokeh plot you just use this line in the blog page where you want the plot to appear.
{% include bokeh_zim_plot.html %}
This is how this plot was included: