Make regular grids from polygons with geopandas
Background
Geopandas is a Python package that provides a geospatial extension to pandas. Geodataframes store geographic data such as points and polygons which can be plotted. This post adapts code from both James Brennans and Sabrina Chans blogs to show how to make square and hexagonal grids out of any polygons. This method is often used to bin areas in discrete regions for the purpose of representing summary statistics.
The functions are given below. Both uses the total boundary area and calculate the number of cells, then loop over them to create regular sets of polygons. At the end we can select out only the overlapping ones to match the boundary if needed.
def create_grid(gdf=None, bounds=None, n_cells=10, overlap=False, crs="EPSG:29902"):
    """Create square grid that covers a geodataframe area
    or a fixed boundary with x-y coords
    returns: a GeoDataFrame of grid polygons
    see https://james-brennan.github.io/posts/fast_gridding_geopandas/
    """

    import geopandas as gpd
    import shapely

    if bounds != None:
        xmin, ymin, xmax, ymax= bounds
    else:
        xmin, ymin, xmax, ymax= gdf.total_bounds

    # get cell size
    cell_size = (xmax-xmin)/n_cells
    # create the cells in a loop
    grid_cells = []
    for x0 in np.arange(xmin, xmax+cell_size, cell_size ):
        for y0 in np.arange(ymin, ymax+cell_size, cell_size):
            x1 = x0-cell_size
            y1 = y0+cell_size
            poly = shapely.geometry.box(x0, y0, x1, y1)
            #print (gdf.overlay(poly, how='intersection'))
            grid_cells.append( poly )

    cells = gpd.GeoDataFrame(grid_cells, columns=['geometry'],
                                     crs=crs)
    if overlap == True:
        cols = ['grid_id','geometry','grid_area']
        cells = cells.sjoin(gdf, how='inner').drop_duplicates('geometry')
    return cells

def create_hex_grid(gdf=None, bounds=None, n_cells=10, overlap=False, crs="EPSG:29902"):
    """Hexagonal grid over geometry.
    See https://sabrinadchan.github.io/data-blog/building-a-hexagonal-cartogram.html
    """

    from shapely.geometry import Polygon
    import geopandas as gpd
    if bounds != None:
        xmin, ymin, xmax, ymax= bounds
    else:
        xmin, ymin, xmax, ymax= gdf.total_bounds

    unit = (xmax-xmin)/n_cells
    a = np.sin(np.pi / 3)
    cols = np.arange(np.floor(xmin), np.ceil(xmax), 3 * unit)
    rows = np.arange(np.floor(ymin) / a, np.ceil(ymax) / a, unit)

    #print (len(cols))
    hexagons = []
    for x in cols:
      for i, y in enumerate(rows):
        if (i % 2 == 0):
          x0 = x
        else:
          x0 = x + 1.5 * unit

        hexagons.append(Polygon([
          (x0, y * a),
          (x0 + unit, y * a),
          (x0 + (1.5 * unit), (y + unit) * a),
          (x0 + unit, (y + (2 * unit)) * a),
          (x0, (y + (2 * unit)) * a),
          (x0 - (0.5 * unit), (y + unit) * a),
        ]))

    grid = gpd.GeoDataFrame({'geometry': hexagons},crs=crs)
    grid["grid_area"] = grid.area
    grid = grid.reset_index().rename(columns={"index": "grid_id"})
    if overlap == True:
        cols = ['grid_id','geometry','grid_area']
        grid = grid.sjoin(gdf, how='inner').drop_duplicates('geometry')
    return grid
The idea is to return a grid over the total area of the map as below. The overlap parameter lets us perform an sjoin to extract only the grid portions overlapping the map.
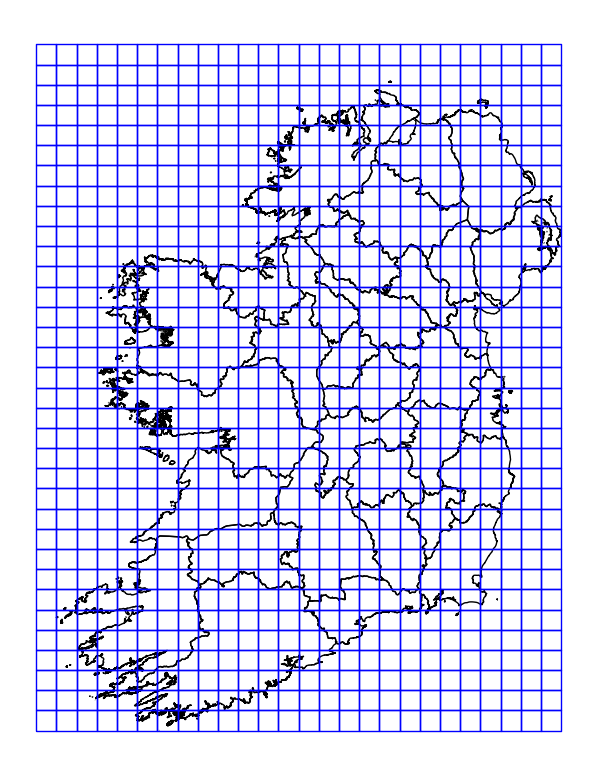
Square grid overlapping the bounds of polygons.
Usage example
First we get a shapefile or other source and load it into a geodataframe. In this example we use a map of the counties of Ireland. Then we use the functions above to make grids and plot them alongside the map.
import pylab as plt
counties = gpd.read_file('metadata/counties.shp')
counties = counties.to_crs("EPSG:29902")

fig,ax = plt.subplots(1,3,figsize=(14,7))
axs=ax.flat
counties.plot(ec='gray',fc="none",figsize=(10,10),ax=axs[0])
gr = create_grid(counties, n_cells=25, overlap=True, crs="EPSG:29902")
gr.plot(fc="none", ec='black',ax=axs[1])
hexgr = create_hex_grid(counties, n_cells=30, overlap=True, crs="EPSG:29902")
hexgr.plot(fc="none", ec='black',ax=axs[2])
axs[0].axis('off')
axs[1].axis('off')
axs[2].axis('off')
Which produces the plot below:
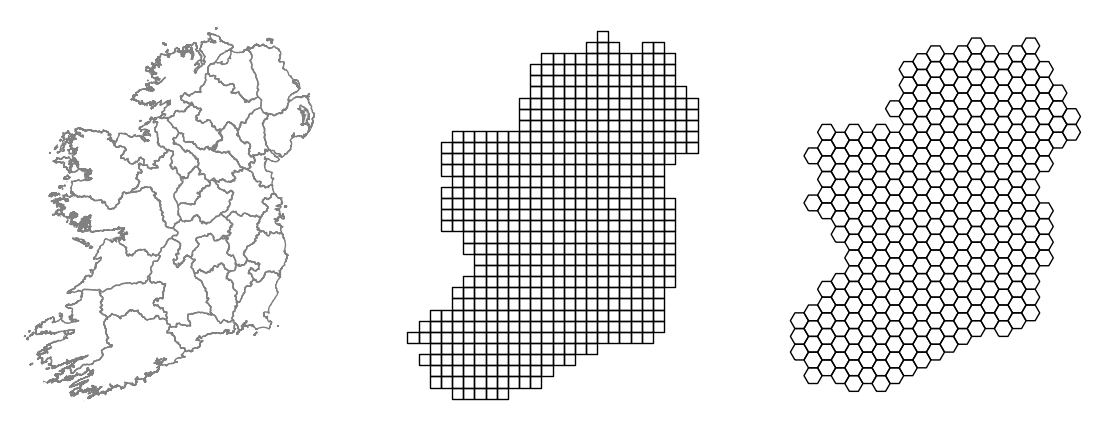
Square and hexagonal grids.
How is this useful
To make practical use of the plot requires some quantitative data added to the grid dataframe. In this case we can simply used the existing columns that were merged when we performed the sjoin step in the functions. This adds the county name for instance. Below we just color by each county. This isn’t a very real world usage of course. There are convenience functions used here for making random colors and making a legend. The code for those is in the notebook here.
fig,ax = plt.subplots(1,2,figsize=(15,10))
axs=ax.flat
types=['square','hex']
funcs = [create_grid,create_hex_grid]
i=0
colors,nmap = get_color_mapping(gr, 'NAME_TAG')
for func in funcs:
    ax=axs[i]
    gr = func(counties, n_cells=50, overlap=True, crs="EPSG:29902")
    gr['value'] = gr.apply(lambda x: np.random.normal(10),1)
    gr['color'] = gr.NAME_TAG.map(nmap)
    gr.plot(color=gr.color,ec='gray',lw=.5,ax=ax)
    ax.axis('off')
    i+=1
make_legend(fig,nmap,loc=(1.05, .9),fontsize=10)
fig.suptitle('Ireland counties',fontsize=26)
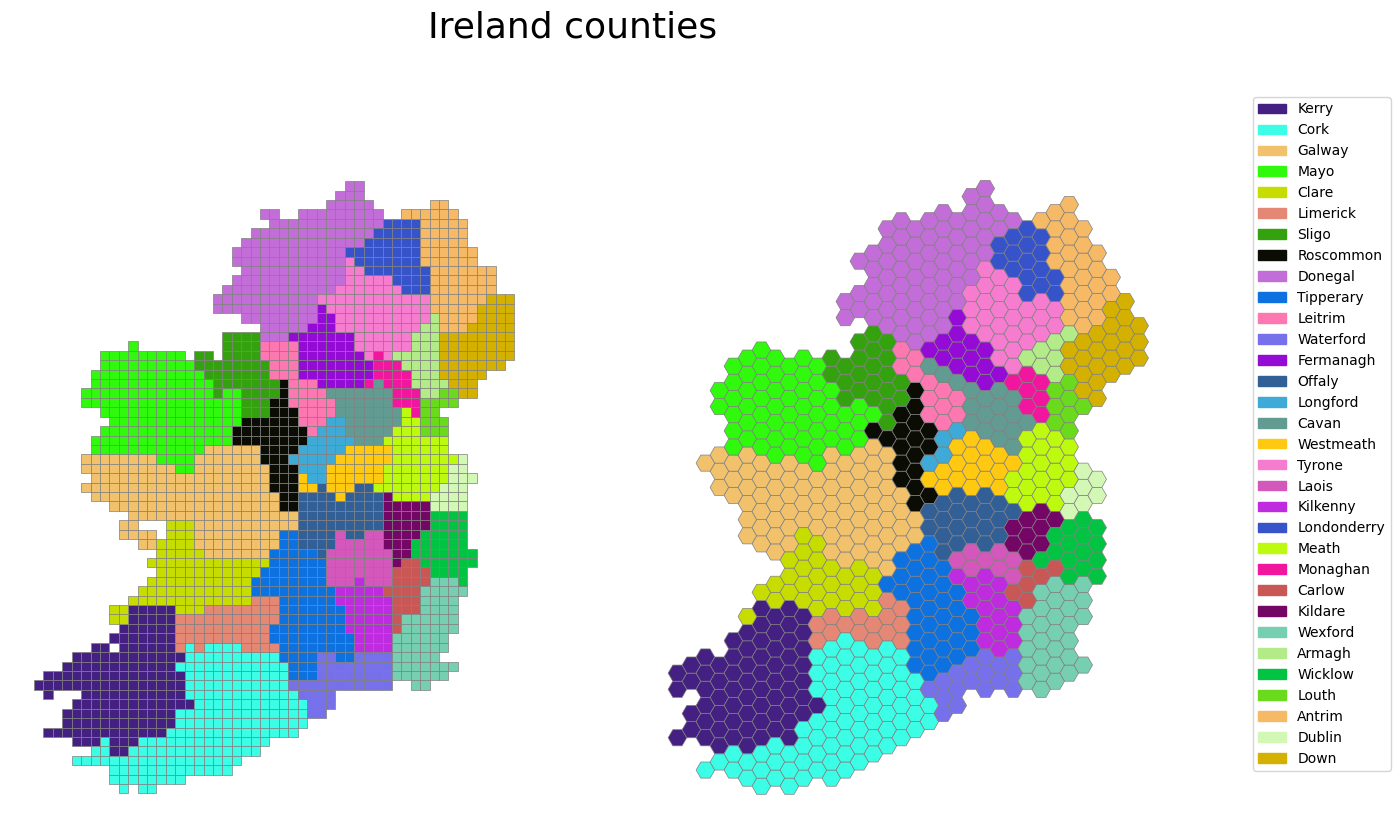
Counties gridded.