Death causes in England and Wales comparison - Winton Centre
Background
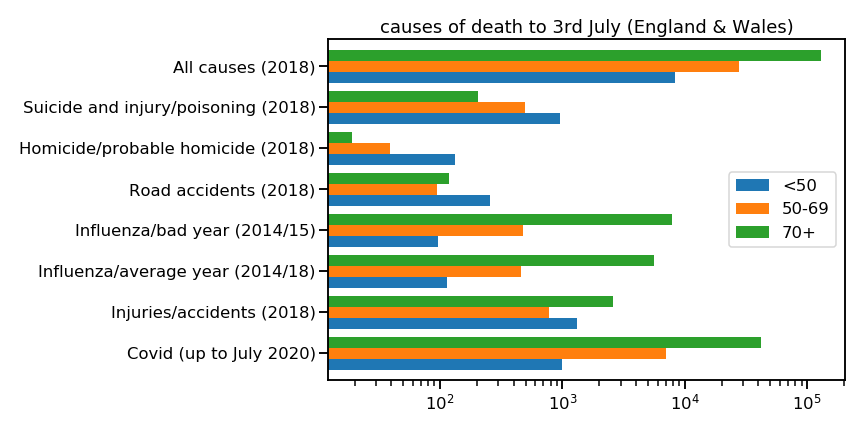
The flood of information about Covid-19 deaths and cases in the media makes it sometimes very hard for people to get information in context. Any number can look big or small without a relative measure. As such it becomes very hard to get a realistic estimate of risk on the part of the public. The Winton Centre for Risk and Evidence Communication have compiled an interesting table of causes of mortality in England and Wales. They have used this to compare typical deaths in the period up to July from a selection of causes to covid-19 estimated deaths. It is worth reading the text in the original page explaining how they made their data table. It is also pointed out that there is no completely ‘neutral’ presentation and that this data is merely showing comparative causes by age group. Though it is obvious that age is the major risk factor, it says nothing about possible long-term health effects of those who became ill. The plots below are made using the second table, deaths scaled to a typical 16 weeks.
Comparisons of 16 weeks of Covid deaths vs other causes in England and Wales
Here the table is broken into three age groups across multiple 5 year bands to compress into one readable plot. The x-axis is a log scale for easier comparison.
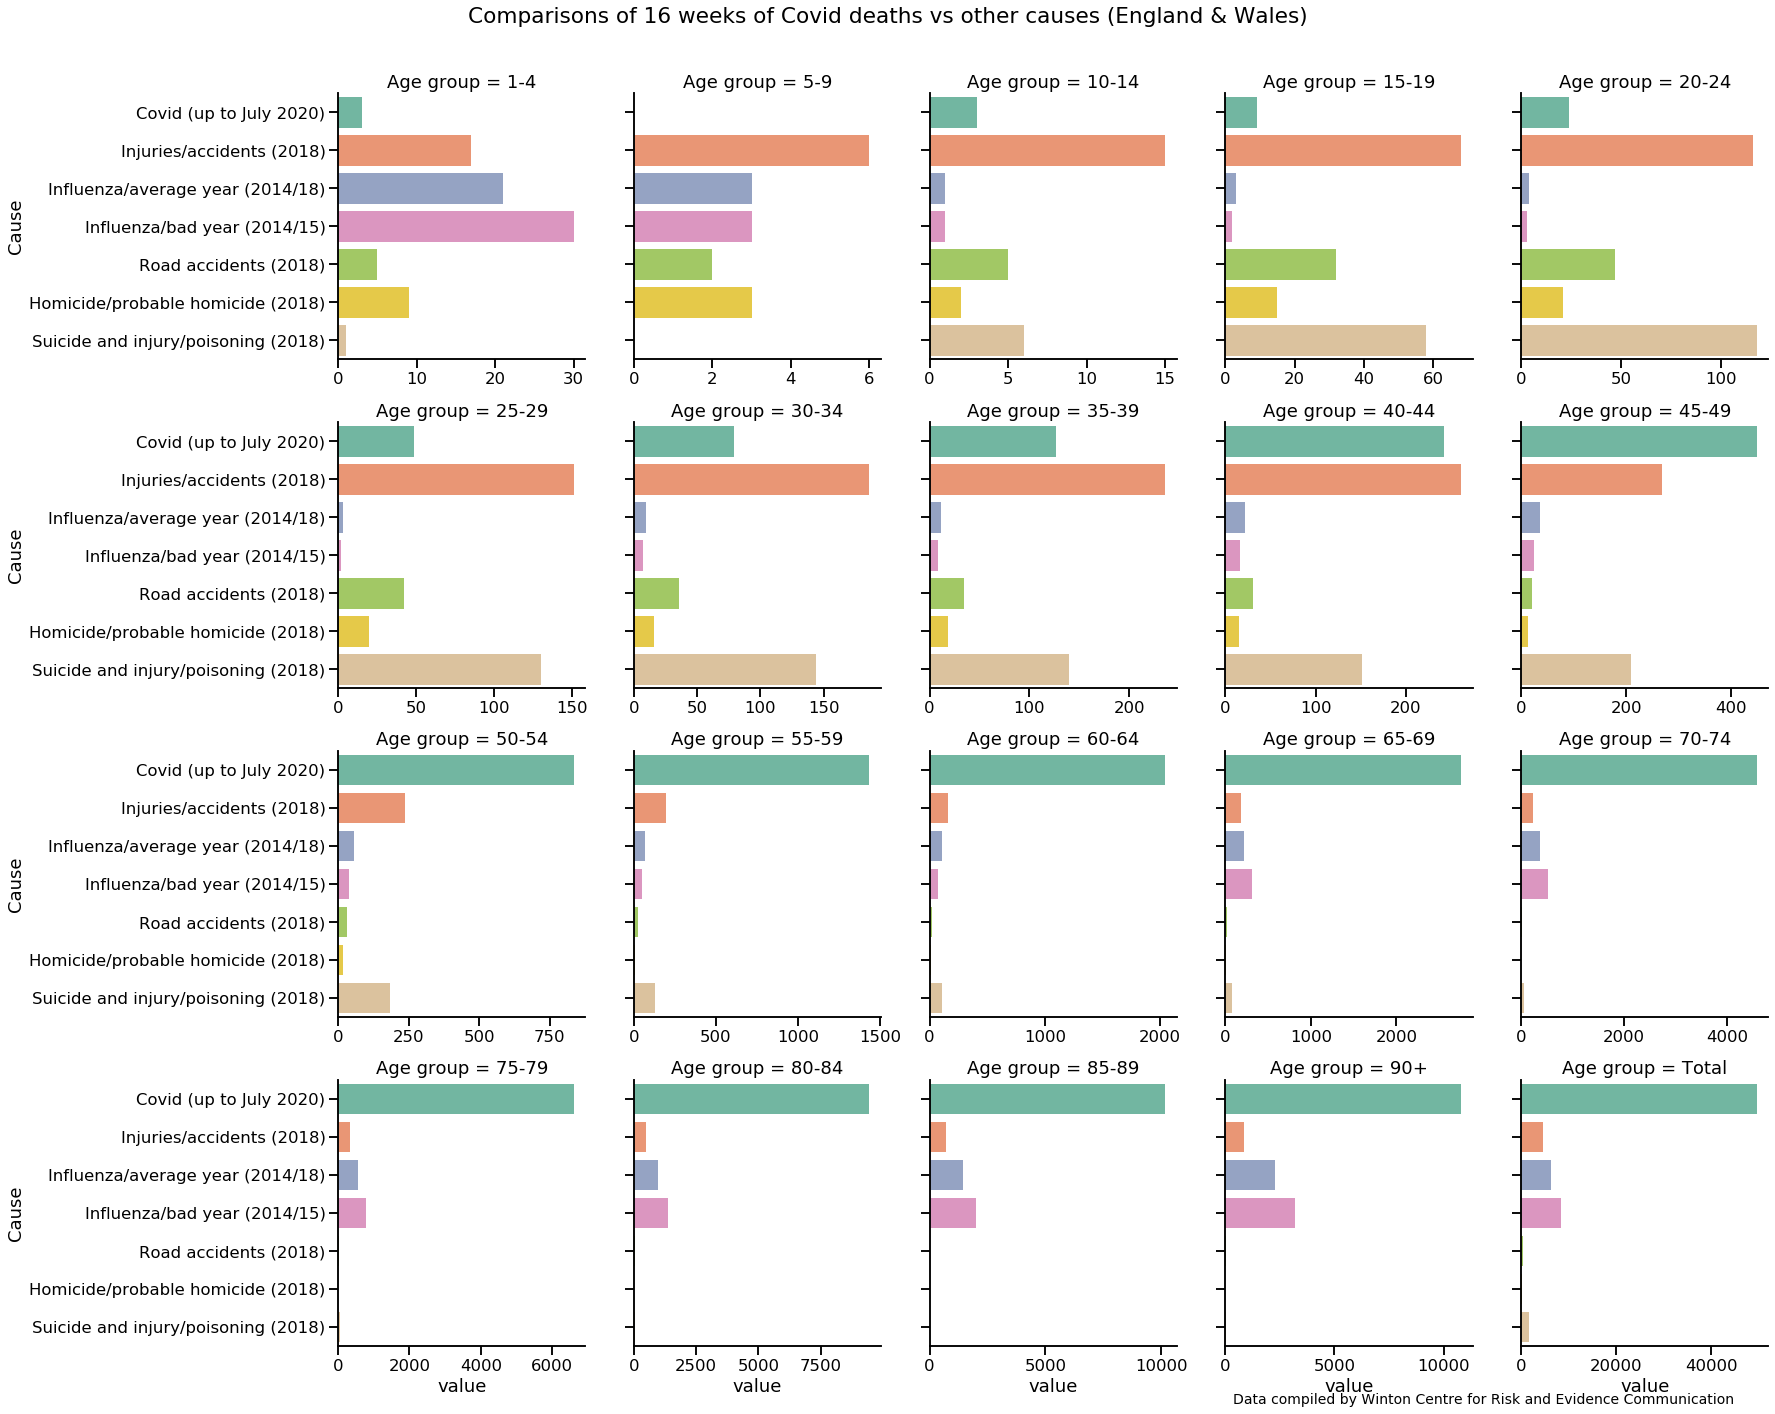
Comparison by age group
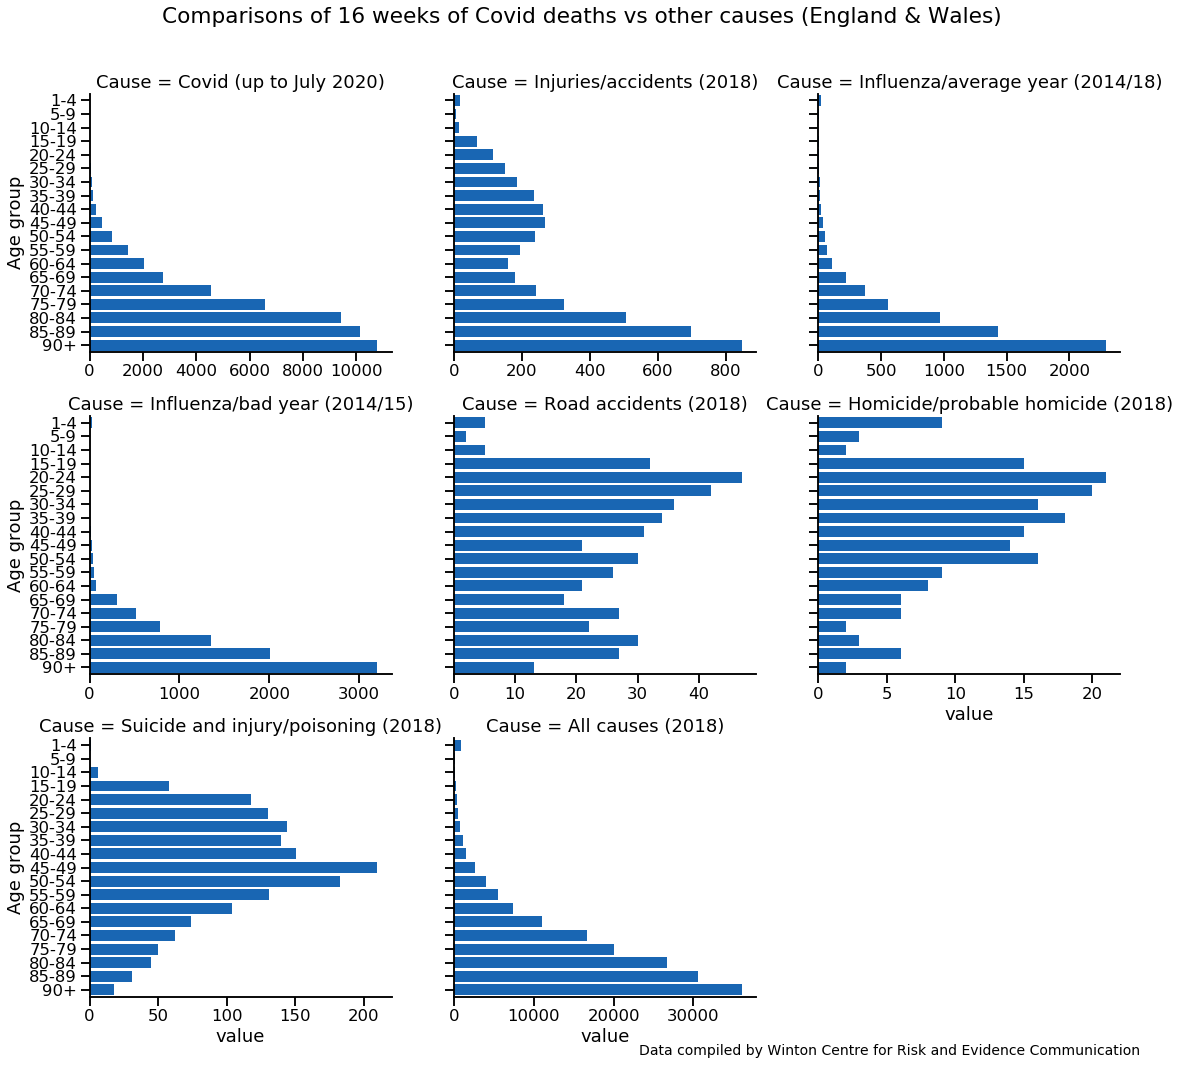
The same data grouped by cause
The jupyter notebook and csv file for making these plots can be found here.