Ireland mortality data from RIP.ie, updated for 2021
Background
See updates here.
Note: The CSO have been analysing RIP.ie data themselves and no doubt they will release an updated analysis in due course (see bottom of post).
In a previous post I showed how to retrieve daily notices from RIP.ie. These can be used to count the number of daily deaths and compare between years. This is a useful proxy for the official registered deaths and provides an up to date estimate of current trends since registered data is delayed by up to 3 months. The method used to extract RIP.ie data here attempts to clean the data of duplicates and extract correct dates. This process is not perfect so the figures are close approximations. What I had not realised before is that there are many deaths outside the Irish state registered and they should be removed to reflect official figures. These have been mostly removed here but some are missed so our values will be a slight overestimate. We can also extract the sex of the individual by checking against common male and female names and also checking the death notice for keywords that indicate it like ‘his family’ and so on. There are still about 1300 unaccounted for in the dataset, mostly people with unusual (or misspelt) names.
The Jupyter notebook with the code is here. You can download the calculated daily death data here.
Year on year comparison
Total deaths are shown in the plot from 2011. The second plot below shows deaths per thousand, calculating using each years population estimate. (Obviously as the population grows deaths will tend to be higher). No adjustment has been made for age distribution as it changes over time. At bottom are the CSO official deaths per year from the GRO. Remember our results are a bit high probably because not all deaths outside ROI were removed. The right plot shows that RIP.ie values are not 1:1 correlated with official values and that they have increased over time at a different rate. Probably in earlier years there was underreporting before the site became universally used.

Yearly totals compared.

Yearly totals rip.ie/gro plotted against each other.
The table shows the data. The diff column is the difference between gro and rip.ie values. In earlier years this is negative because the rip.ie estimate is lower. In 2020 the difference is over 600 which seems like an anomaly. There is no official data for 2021 yet.
| year | pop | deaths | deathsper1000 | gro | diff |
|---|---|---|---|---|---|
| 2008 | 4485100 | 26534 | 5.916033 | 28274.0 | -1740.0 |
| 2009 | 4533400 | 26898 | 5.933295 | 28380.0 | -1482.0 |
| 2010 | 4554800 | 26692 | 5.860191 | 27961.0 | -1269.0 |
| 2011 | 4574900 | 25069 | 5.479683 | 28456.0 | -3387.0 |
| 2012 | 4585400 | 26211 | 5.716186 | 29186.0 | -2975.0 |
| 2013 | 4593100 | 27477 | 5.982234 | 29504.0 | -2027.0 |
| 2014 | 4609600 | 28139 | 6.104434 | 29252.0 | -1113.0 |
| 2015 | 4652425 | 29360 | 6.310687 | 30127.0 | -767.0 |
| 2016 | 4695779 | 30494 | 6.493917 | 30667.0 | -173.0 |
| 2017 | 4753279 | 30446 | 6.405263 | 30418.0 | 28.0 |
| 2018 | 4818690 | 31409 | 6.518162 | 31140.0 | 269.0 |
| 2019 | 4882495 | 31543 | 6.460426 | 31184.0 | 359.0 |
| 2020 | 4937786 | 32423 | 6.566303 | 31765.0 | 658.0 |
| 2021 | 4990000 | 35050 | 7.024048 | - | - |
By sex
Here we show the mean and distribution of monthly values by sex using a boxplot:

Total deaths by year/sex.
2021/2020 average trends
A rolling average of daily deaths for 2020/2021 is shown below. The 3 year average is taken from 2017-2019 (using older years may skew this too low). The trends shows the pandemic peak in 2020 and the 2021 Winter peak. Also seen are unusually high values for the latter half of 2021.
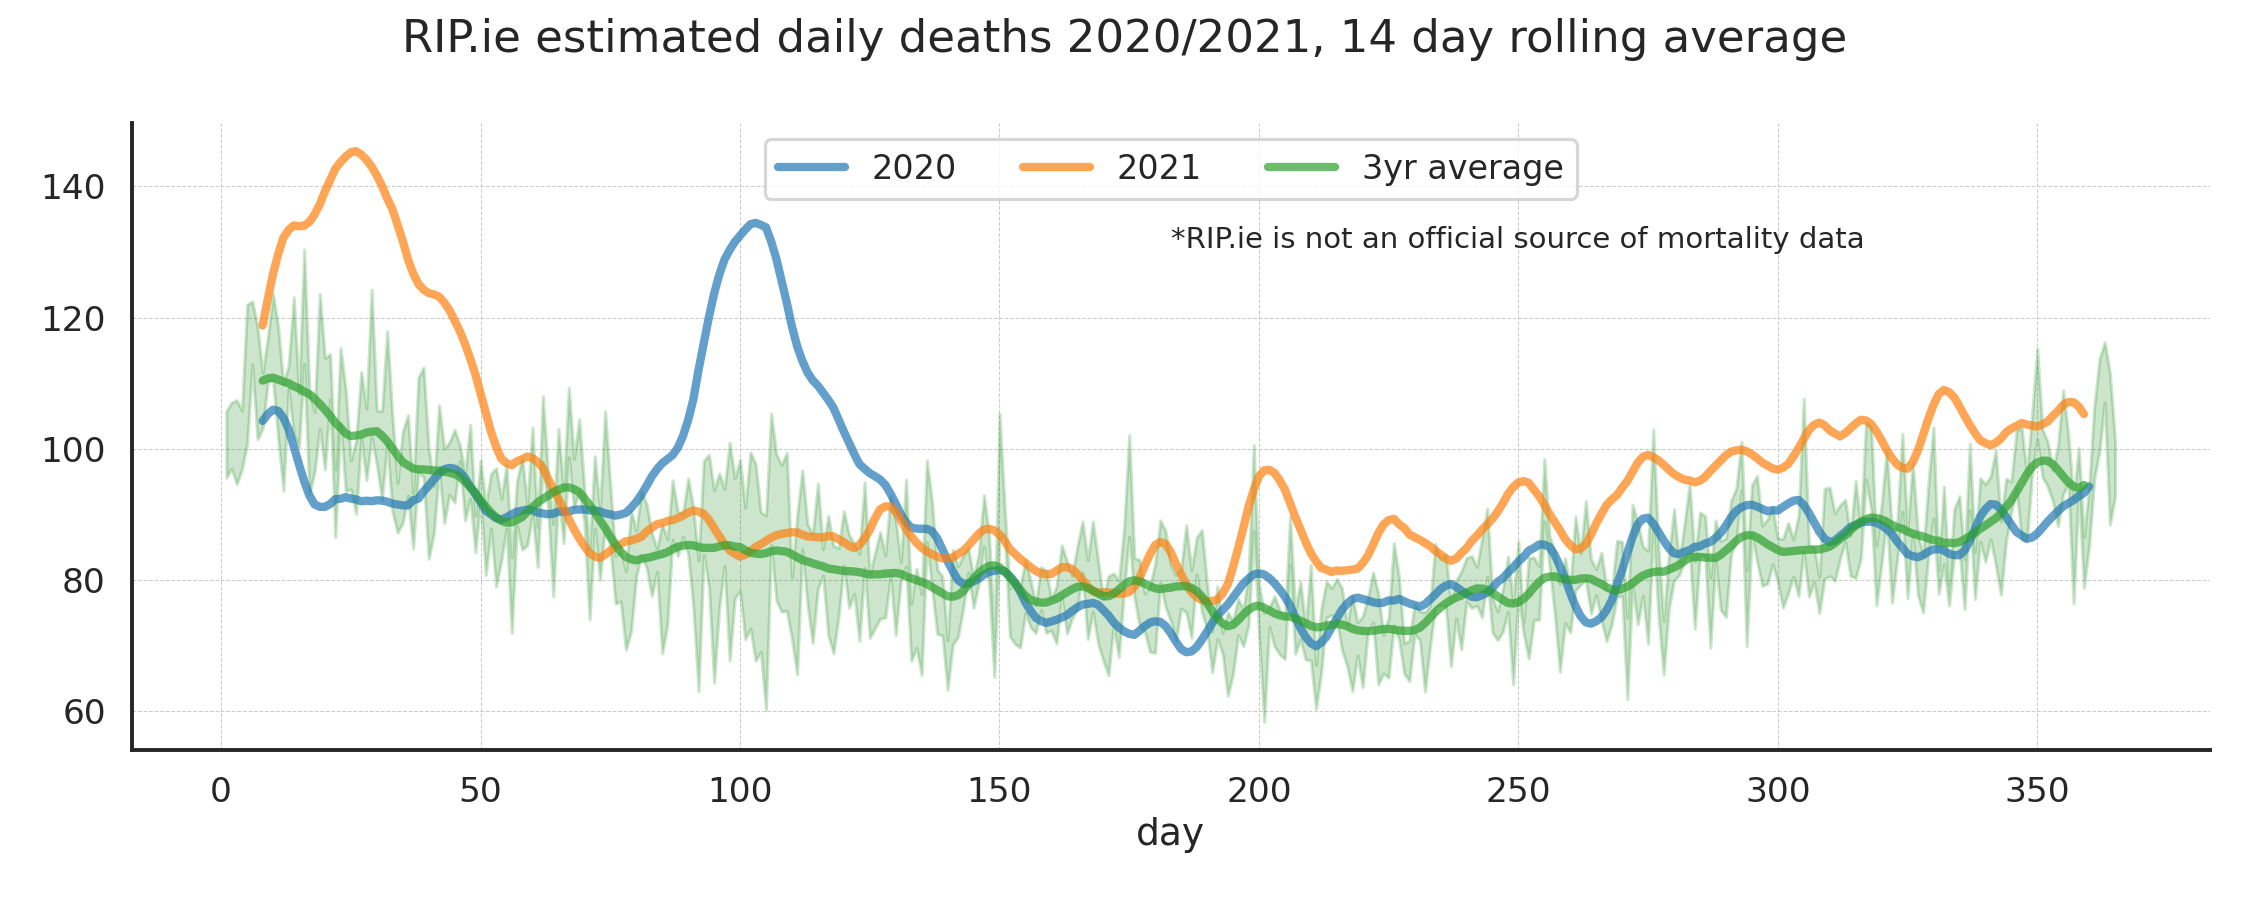
Average daily deaths compared from 2020/2021.
The higher values in 2021 can also be shown as weekly totals here:
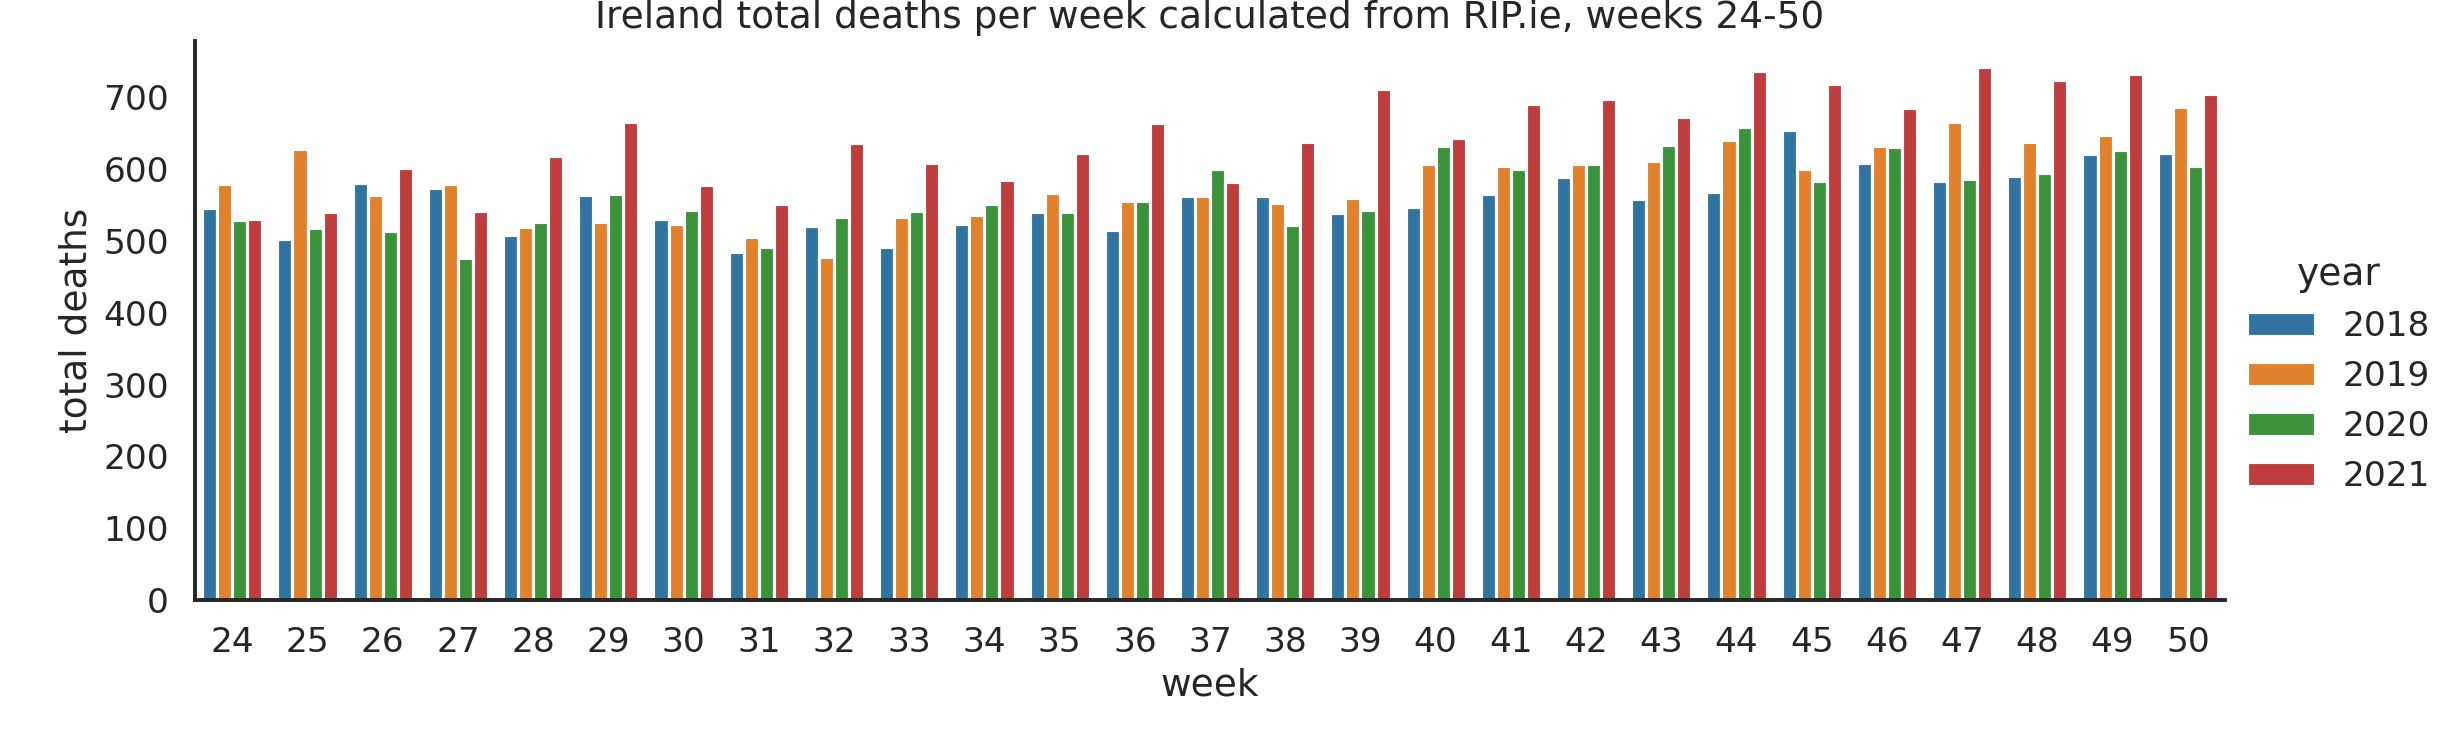
Weekly death totals compared from 2018-2021.
The higher trends in late 2021 don’t appear to be reflected in the current Euromomo data. Shown below are z-score values.
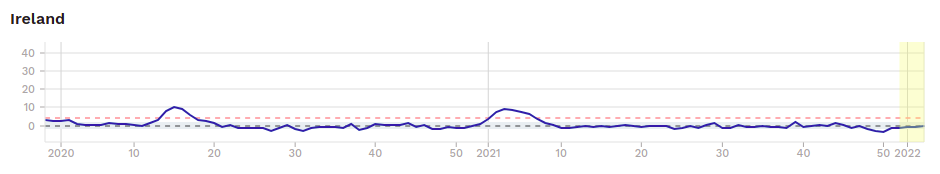
Euromomo deaths for Ireland 2018-present.
Care homes
We can extract references to nursing homes in each death notice. This gives a somewhat crude estimate of deaths in elderly care facilities as a distinct category. The values for each month per year as shown below in a heatmap. The spike in April of 2020 is shown clearly. These results tally roughly with the CSO press release that mentions 1,000 in January and 737 in February deaths in 2021. Note the right plot shows that entries mentioning care home increase sharply since 2008. I assume this is partly due to changes in the way notices are reported over time. Perhaps older entries tended to have less details in the notice.
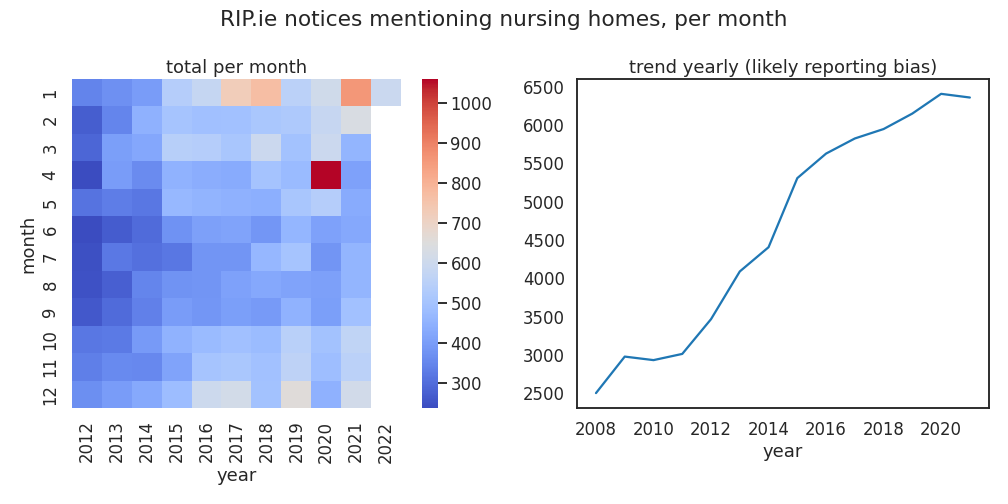
Counts of notices with nursing homes mentioned.
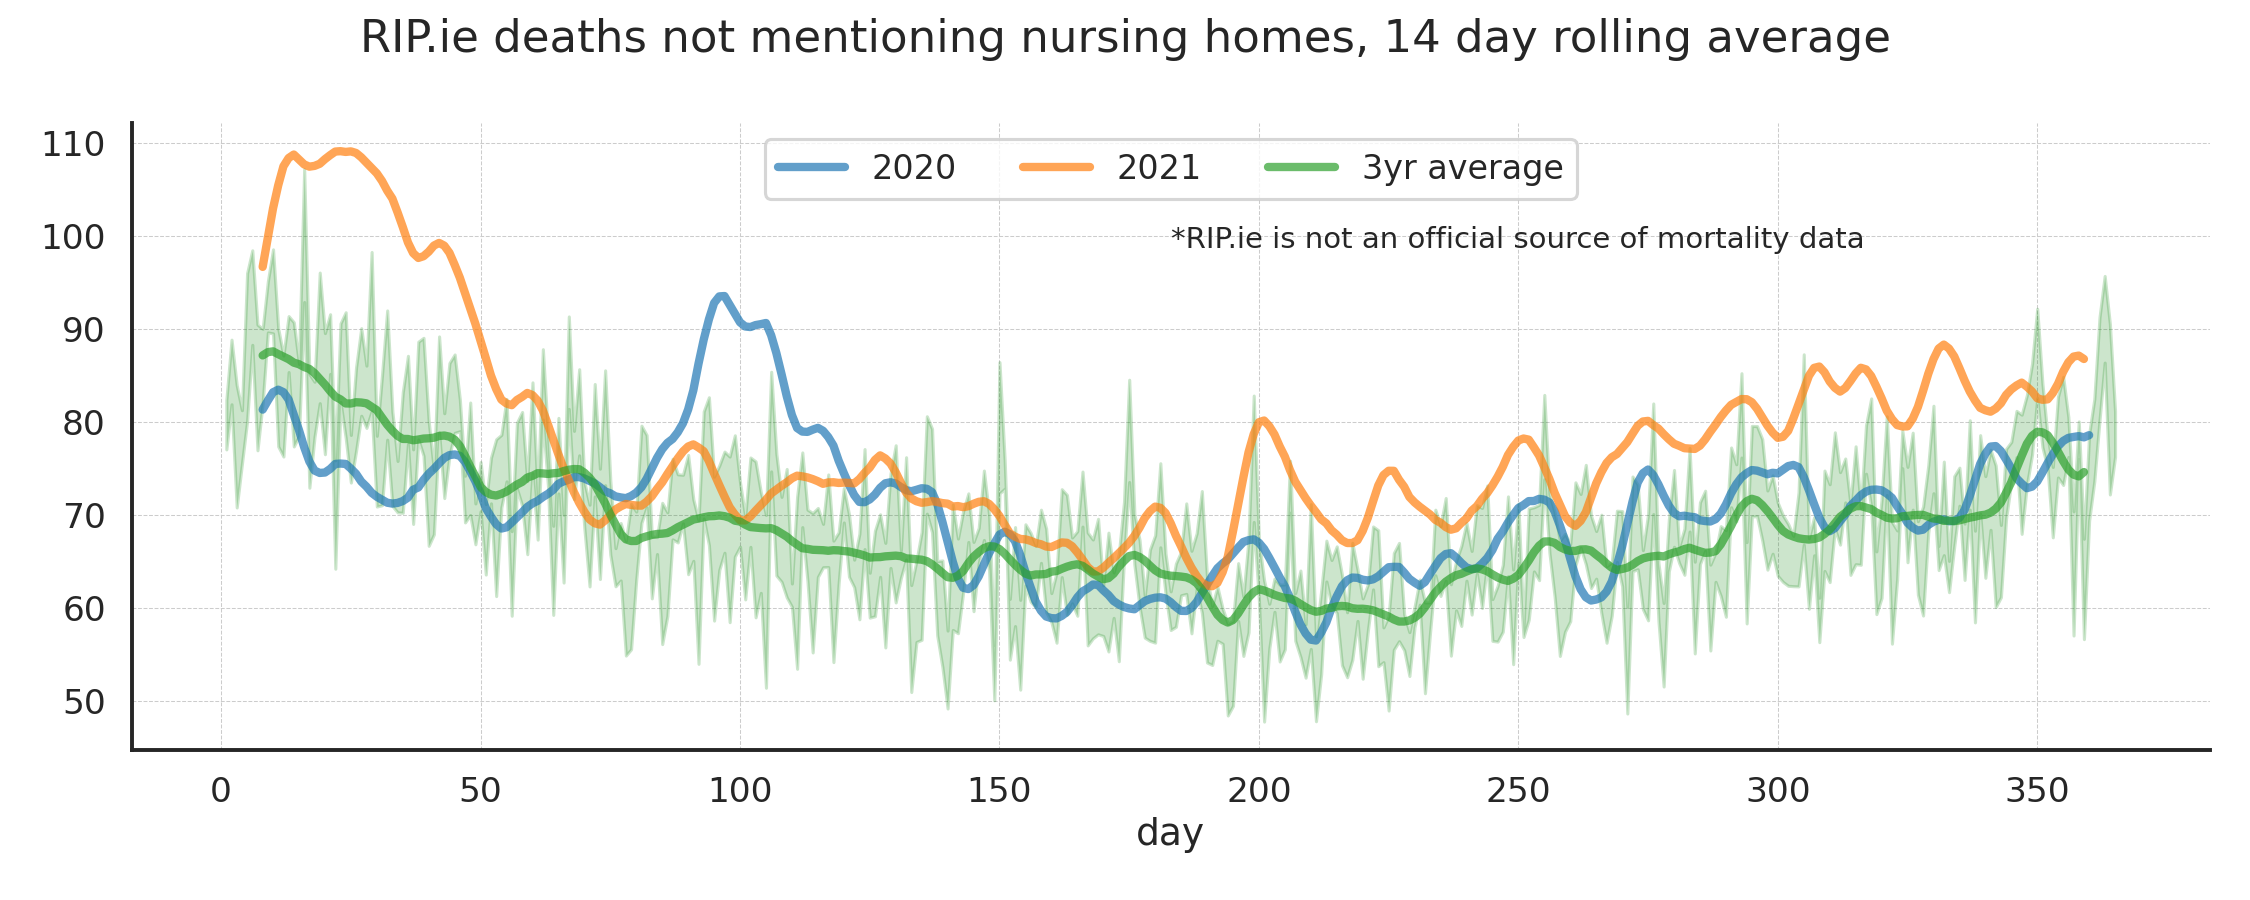
Estimated average deaths outside nursing homes.
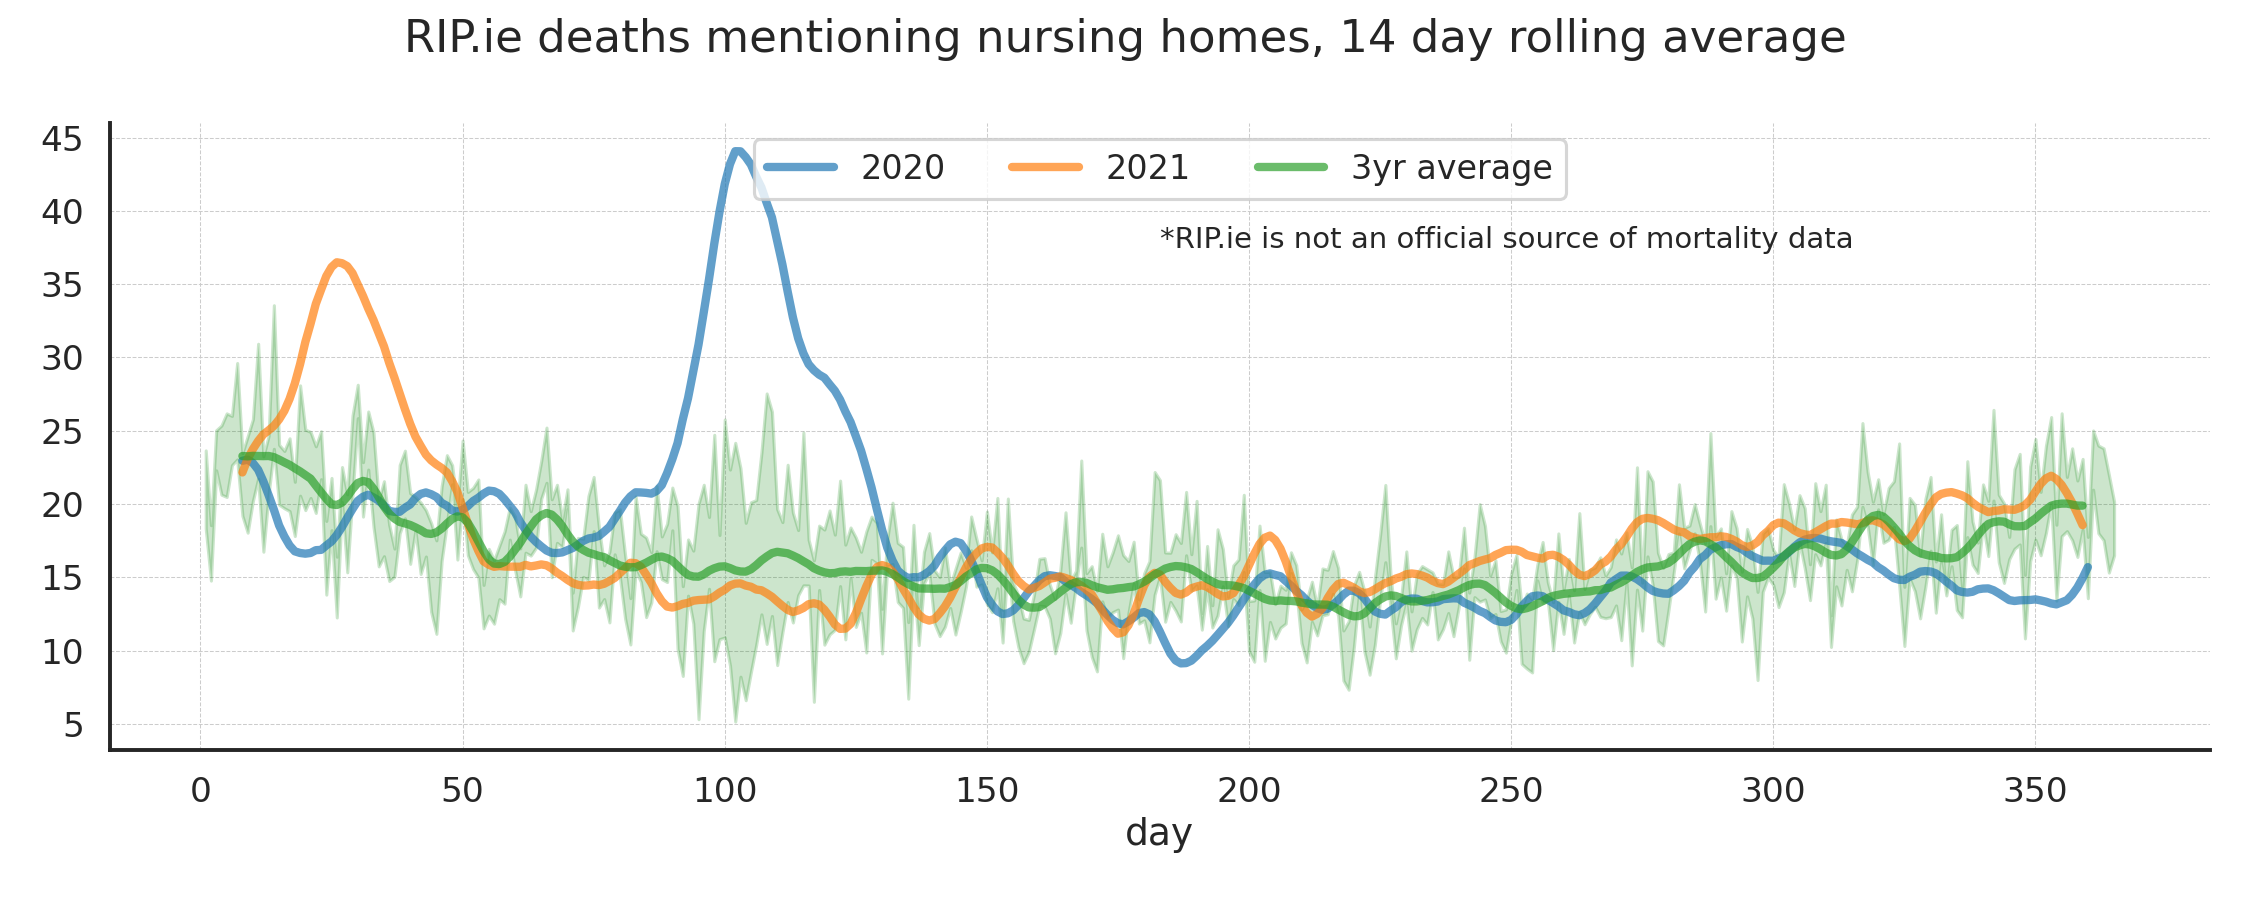
Estimated average deaths in nursing homes.
CSO RIP.ie estimates
The CSO is also using RIP.ie to get up to date mortality estimates in addition to their regular method of using the official death registry. They likely use a very similar method of cleaning the data, only better. Their estimates can be accessed via their Pxstat system here. They currently seem to have data up to July 2021 only. It is useful to compare their data with ours here, shown below. My values are consistently slightly higher because I have probably not completely cleaned all deaths outside the state yet.
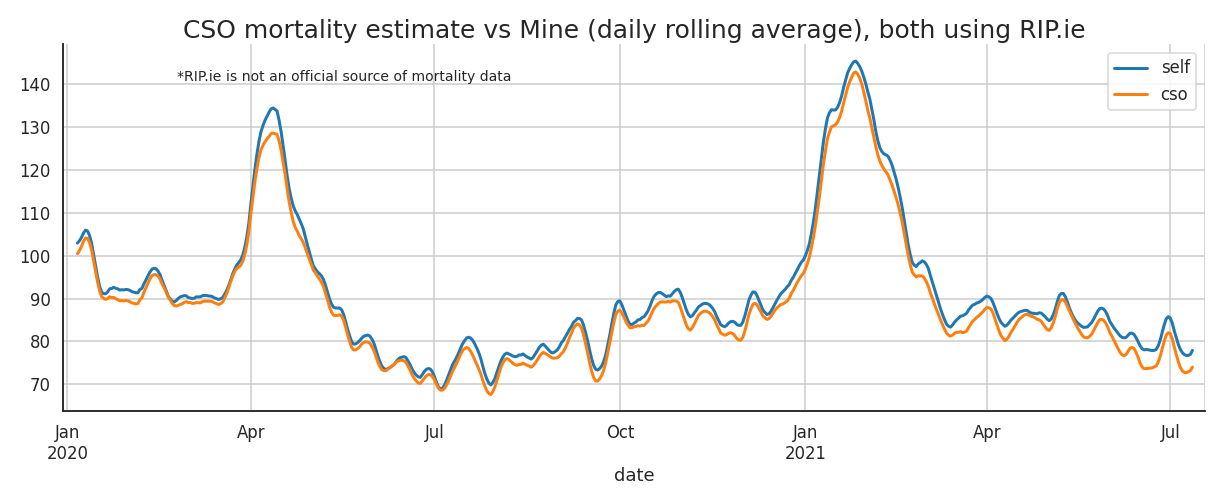
Rolling averages of mine and cso estimates compared.
It has been pointed out by Seamus Coffey here that Ireland has been added to the Eurostat deaths data series. They use their RIP.ie data for this.
RIP.ie not ideal but provides valuable insight
RIP.ie was not really designed for this task and therefore we cannot further analyse this data by age group for example. We can see that the reporting changes over time and that deaths increase at a different rate each year compared to the official figures. So any conclusions drawn from this data must be carefully checked for bias. For example it is possible that the increase from June 2021 months is an artifact due to changes in how deaths are recorded, though this seems unlikely.